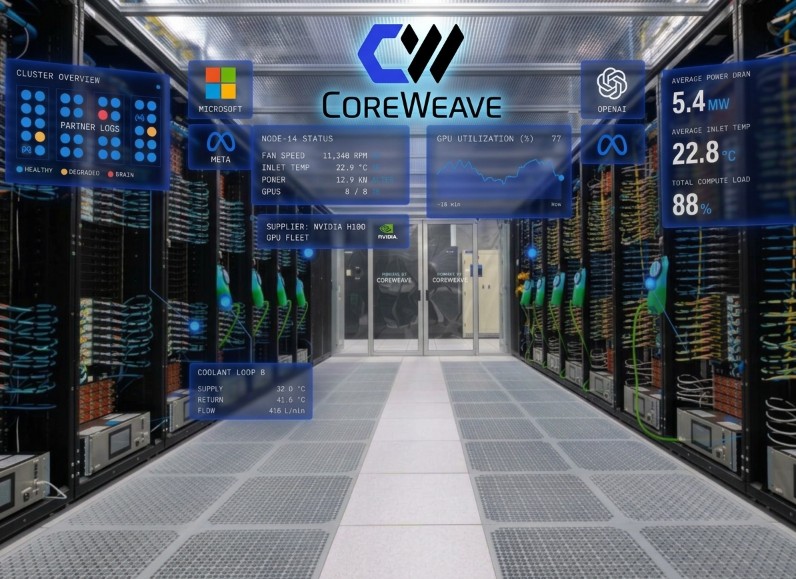
The AI infrastructure market is showing a split. Equity investors are focused on hypergrowth, while credit markets are pricing in near term financing costs. For CoreWeave (CRWV), a leader in the specialized AI cloud space, that gap raises a clear question: how does a company with massive demand turn it into financial strength?
The answer is already visible. CoreWeave reported a $104 billion contract backlog, and the company has several practical tools to convert that backlog into a stronger balance sheet.
1. Why CoreWeave Demand Is Not the Problem
Few companies can say their growth is already contracted years ahead.
Record backlog: Contracted revenue reached $104 billion at the end of Q2, with more than $25 billion in new commitments added shortly after.
Capacity nearly sold out: Management says capacity through 2027 is almost fully booked, and customers are already reserving space for 2028 to 2030.
Top tier customers: Multibillion dollar commitments from Microsoft, Meta, and OpenAI validate the demand.
When customers line up years in advance, a company has real leverage in how it structures its financing.
2. Turning Backlog Into Cash Flow
Multi year compute contracts turn into revenue gradually, over 3 to 5 years, as data center capacity comes online. As more capacity goes live, the revenue base grows and the financing picture improves with it. The $51.9 billion in total debt and lease obligations funded the buildout of that capacity, and the contracts behind it support the repayment.
3. The CoreWeave Toolkit for the 2026 to 2027 Window
CoreWeave has several ways to bridge the gap between near term maturities and long term contract payoffs:
Customer prepayments: Large upfront cash from customers, a model peers like IREN use, can fund buildouts without adding more high yield debt. With demand this strong, CoreWeave is well positioned to ask for it.
Nvidia ecosystem support: As a key hardware partner, Nvidia has a stake in a healthy GPU market, so collateral support or equity linked financing is a realistic option.
Equity and convertibles: Share offerings or convertible bonds dilute existing holders, but they offer a direct way to pay down senior debt and reduce interest costs.
Refinancing on better terms: As contracted revenue turns into reported cash flow, lenders get more evidence that the backlog is real, which can open the door to lower cost debt over time.
The $10.6 billion due over the next 24 months is sizable, but it sits against a $104 billion backlog.
4. Looking at CoreWeave Through a Fundamental Lens
Credit matters, but it helps to separate two kinds of problems.
Credit is something every company has to manage. It is a controllable element, handled through refinancing, prepayments, equity raises, and better contract terms. A business with strong demand has more ways to fix it than a business without demand.
What actually breaks a long term investment case looks different:
Fraud or accounting problems: Trust in the numbers is gone.
Revenue and growth rolling over: Demand is fading.
Earnings per share falling quarter after quarter: The business is getting weaker, not just more expensive to finance.
Rising debt with no progress: More borrowing, but no new capacity, customers, or revenue to show for it.
Right now, none of these is the story. Revenue is growing, backlog is expanding, and new debt is going toward capacity that customers have already contracted for.
The current credit stress also looks more like a macro problem than a company problem. High inflation and high interest rates put pressure on any high growth company that funds expansion with debt. That pressure tends to ease as rates settle, and it hits fast growers hardest before the cash flows arrive.
So I do not see this as the time to sell. The signals that would change my mind are about the business itself, not the temporary cost of financing it.
5. Why the Market Is Still Moving in CoreWeave’s Favor
CoreWeave is part of a broader shift in AI cloud infrastructure, where scarce capacity is gaining value.
Hyperscalers leasing capacity as fast as it comes online
Premium pricing on scarce megawatt capacity
Next step
Convert backlog into cash flow and lower financing costs
Scale within grid interconnection timelines
Both models benefit from the same trend: demand for compute is outrunning supply.
The Bottom Line
Demand for CoreWeave is clear, and hyperscalers are leasing capacity as fast as it can be deployed. A $104 billion backlog gives the company real negotiating power with customers, partners, and lenders.
Credit is a real element to watch, but it is a solvable one. The things that would make me sell are fraud, shrinking revenue and growth, steadily falling earnings, or more debt without progress. Until I see those, I treat the credit stress as a high rate environment problem, not a broken business.
For long term investors, the key things to watch are how much of the backlog converts into revenue, whether customer prepayments become part of new deals, and how the refinancing window plays out. If CoreWeave executes, the same backlog that looks heavy today could become the foundation of a much stronger balance sheet.
Disclosure: The author has no position in $CRWV and no commercial relationship with the company
Every few years, a new company promises to fix the battery problem that lithium ion cannot solve. Most fade. Eos Energy Enterprises (NASDAQ: EOSE) is different. It has gotten products into the ground. It has built a factory. It has started signing serious contracts. And it is doing all of this on a chemistry almost nobody else is scaling: zinc.
This piece covers what the company does, why AI data center developers are suddenly paying attention, and where the business stands today. It draws on the company’s own filings and recent reporting, not investor hype.
What Eos Energy Actually Does
Eos was founded in 2008. The company is now headquartered in Pennsylvania, after relocating from Edison, New Jersey. Eos designs, manufactures, and sells long duration battery energy storage systems, usually shortened to BESS. In plain terms, these are large batteries. Utilities, industrial sites, and commercial customers use them to store electricity and release it over several hours, rather than seconds or minutes.
The Znyth Chemistry
A zinc based aqueous battery, called Znyth, sits at the core of the technology. It powers the company’s newest battery module, the Z3. Znyth uses just five commodity materials. None of them are rare earth or conflict minerals, and that sets it apart from lithium, cobalt, and other materials that are often imported and geopolitically sensitive.
The process is simple to describe. During charging, zinc deposits onto the battery’s electrodes. During discharge, it dissolves back into the electrolyte. Engineers have understood this electrochemical idea for decades. Eos spent years turning it into something that can be manufactured at volume and sold at a competitive price.
The Product Line
The finished systems carry names like the Eos Cube, Hangar, and Indensity. Eos builds them for 3 to 16 plus hour discharge windows. The industry generally calls this long duration or mid duration storage.
What Makes the Technology Different
Lithium ion dominates the battery storage market today. Tesla, Fluence, CATL, and Sungrow control the large majority of installed capacity worldwide. Lithium performs well at short bursts, typically two to four hours. But it hits real limits past that window. Cost per stored megawatt hour climbs. Fire risk becomes a bigger operational concern at scale. And the supply chain runs mostly through overseas mining and processing.
Eos pitches zinc as a direct answer to those pain points. A few things stand out.
Safety and Durability
The system is non flammable. Its aqueous, water based chemistry avoids the thermal runaway risk that defines lithium ion. That means the Z3 skips the costly fire suppression and active cooling equipment that lithium installations typically require.
The battery also holds up over time. Eos rates its cells for roughly 6,000 charge and discharge cycles, which works out to about 20 to 25 years of service. The company says the batteries deliver full depth of discharge with very little capacity fade as the years go on.
Domestic Sourcing and Incentives
Eos builds and sources the batteries entirely in the United States. That qualifies them for domestic content rules and for federal incentives, including the Section 45X production credit and the Section 48E investment tax credit under the Inflation Reduction Act. Together, these credits are worth an estimated 90 million dollars or more per 2 GWh production line each year.
The systems are also simpler to run day to day. They need no active thermal management, they tolerate a wide operating temperature range, and they carry lower ongoing maintenance overhead than a lithium fleet of similar size.
None of this makes zinc a universal replacement. Lithium still wins on very short, high power bursts. Eos is chasing the multi hour middle ground instead, roughly 4 to 16 plus hours of discharge. That happens to be exactly what grid operators, utilities, and increasingly data centers are short on.
The AI and Data Center Angle
AI data centers pull enormous, sustained amounts of power. The U.S. Energy Information Administration expects power demand to hit record highs in both 2026 and 2027, largely because of AI driven load growth. Global data center electricity demand could roughly triple by 2030.
The real challenge for hyperscalers is not simply finding more electricity. It is finding firm, reliable, long duration capacity fast, often faster than the traditional grid interconnection process can deliver. That challenge lines up naturally with what Eos already builds. AI workloads need power for longer stretches than lithium’s two to four hour profile comfortably covers, and they need it now rather than in five years.
How Eos Is Capturing This Demand
Eos has gone after AI power demand in two main ways.
First, data center customers now make up roughly a fifth of the company’s total commercial pipeline. That segment barely existed for Eos two years ago.
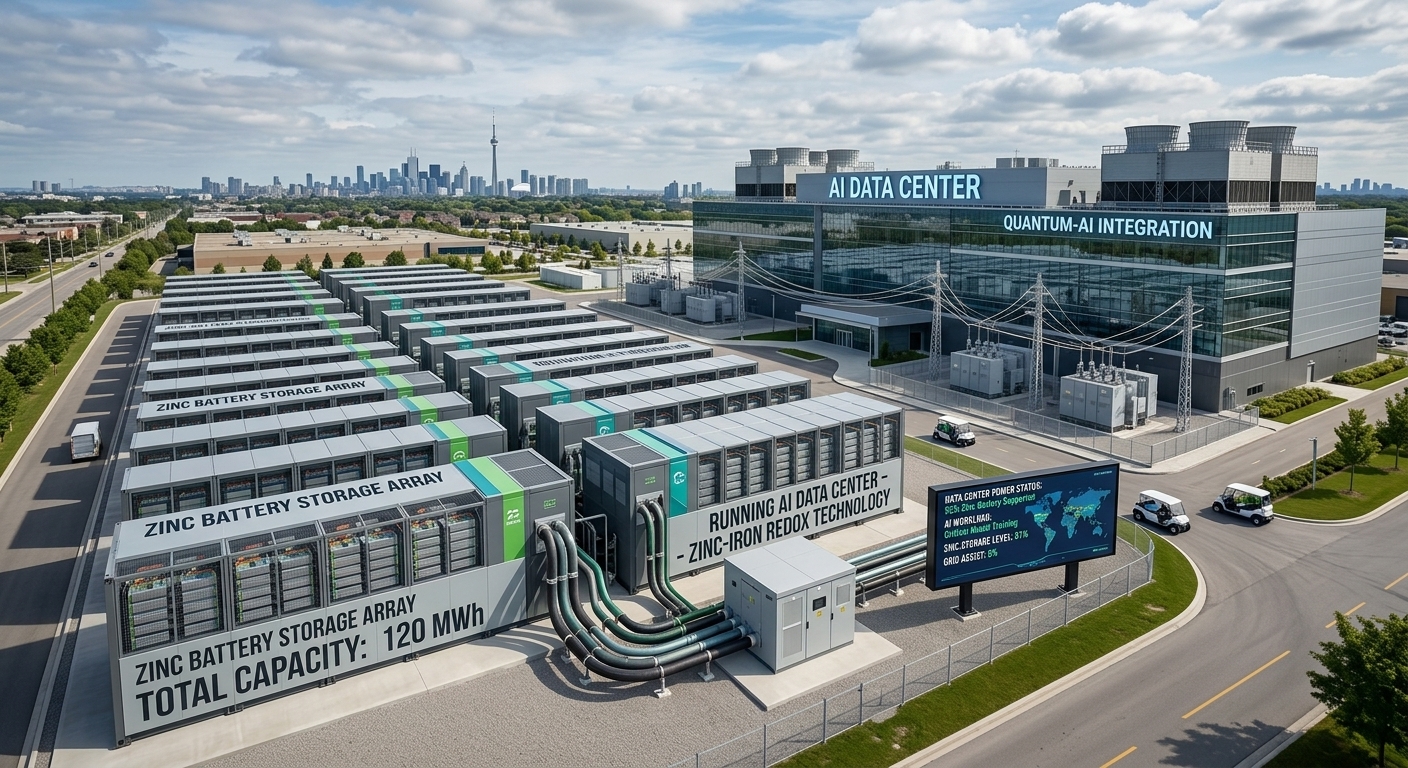
Second, in April 2026, Eos signed a joint development agreement with TURBINE-X Energy. The partnership builds behind the meter private power infrastructure for AI data centers, pairing gas fired generation with Eos’s Indensity battery architecture. The goal is firm, dispatchable, on site power delivered in months rather than years. TURBINE-X is targeting up to 2 GWh of Eos battery storage across a 36 month rollout, with initial deployments expected in 2027. Eos CEO Joe Mastrangelo has called AI data center demand an accelerant for the company’s business.
This positions Eos alongside much bigger players serving hyperscale data centers, names like NextEra Energy Resources and Fluence Energy. That is a real jump in visibility for a company that, until fairly recently, was mostly known as a struggling grid storage upstart.
Production and Manufacturing
Eos manufactures in Pennsylvania, mainly at its Thorn Hill facility in Marshall Township, near Pittsburgh. The company commissioned a second battery production line there in mid 2026, and it already runs faster cycle times and higher yields than the first line. Eos is consolidating manufacturing into Thorn Hill specifically to cut conversion costs. The facility is targeting roughly 4 GWh of annual production capacity by the end of 2026.
A separate U.S. Department of Energy Loan Programs Office loan guarantee, worth up to roughly 305 million dollars, is financing two additional manufacturing lines for next generation zinc bromine systems. Eos could add two more lines on top of that, for four in total, across Turtle Creek and Duquesne, Pennsylvania. The DOE says this build out could reach over 8 GWh of annual storage capacity by 2026, enough to instantaneously power more than 300,000 average U.S. homes.
Costs are moving in the right direction too. Eos reported a 12.5 percent material cost reduction on the Z3 product. It achieved that reduction in under a year through supplier renegotiation and simpler design choices.
Backlog, Pipeline, and Financials
Looking at the most recent reporting from Q2 2026, a few numbers stand out.
Backlog and Pipeline
Backlog sits at approximately 807 million dollars. That figure is up 25 percent from the prior quarter and 20 percent year over year, representing 3.4 GWh of contracted storage capacity. It is a company record.
The commercial opportunity pipeline tells a similar story. It includes proposals and letters of intent rather than signed contracts, and it has grown to approximately 24.6 billion dollars. That is up 31 percent year over year, spanning roughly 112 GWh across utility, industrial, commercial, and data center customers.
Think of the pipeline as a measure of demand in the room. The backlog is the portion of that demand actually locked into paper. The chart below shows how the pipeline has grown over the past year.
Revenue and Guidance
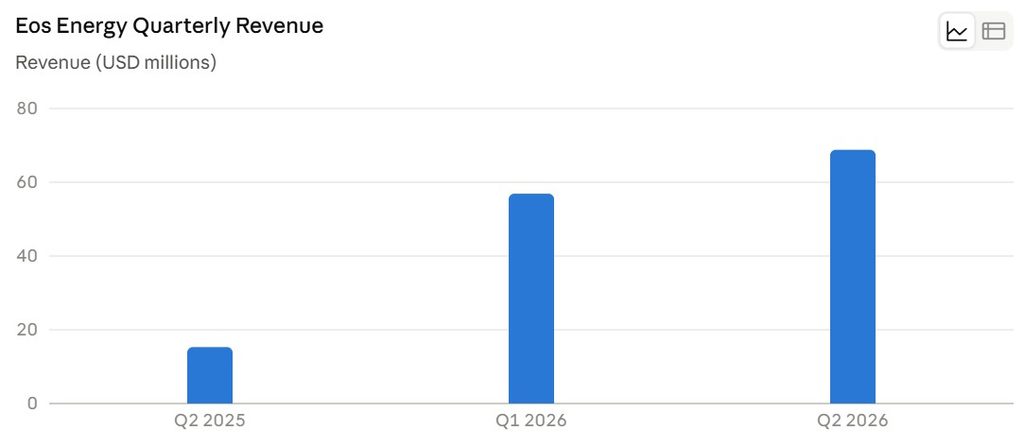
Revenue reached 68.8 million dollars in Q2 2026 alone, up 351 percent year over year. First half 2026 revenue of 125.7 million dollars already surpassed everything the company brought in during all of 2025. Full year 2026 guidance was tightened to a range of 300 to 350 million dollars, down from a prior 300 to 400 million dollar range. Eos attributes the change mainly to its planned manufacturing consolidation into Thorn Hill.
Cash, Losses, and Frontier Power USA
Cash on hand stood at approximately 364 million dollars as of June 30, 2026, including restricted cash. Profitability, though, remains a real problem. Q2 2026 gross margin came in around negative 71 percent. The net loss for the quarter reached 275.7 million dollars, driven mostly by fair value accounting adjustments, and the adjusted EBITDA loss came in at 71.4 million dollars. Eos is scaling its top line quickly while still burning a lot of cash to get there.
One structural piece worth understanding is Frontier Power USA, often shortened to FPUSA. Eos formed this joint venture with Cerberus Capital Management and Hudson Bay Capital Management. FPUSA raised 263 million dollars to support an estimated 1 billion dollars in project deployment capital. It acts as a financing arm that turns Eos’s project pipeline into built, operating assets faster than Eos could fund on its own. FPUSA has already converted its first purchase order, the Redbird project in Texas, against a 2 GWh capacity reservation agreement it holds with Eos.
Well Known Customers and Contracts
The customer base spans utilities, renewable developers, and, more recently, data center infrastructure players.
Bridgelink Investments, also known as Bridgelink Commodities, is a large renewable developer with more than 8 GW of projects in development. It holds a 1 GWh master supply agreement with Eos tied to grid resilience and energy curtailment recapture in the ERCOT market in Texas.
Frontier Power USA is the co funded joint venture described above. It holds a 2 GWh firm capacity reservation agreement plus a broader 12 to 16 GWh development pipeline across ERCOT, PJM, CAISO, and MISO.
Duke Energy was an early pilot customer, going back to a 1 MW, 4 MWh installation in 2019. It later became a booked order customer as well. Ameresco, Blue Ridge Power, Pine Gate Renewables, and Center Line Electric placed booked orders during the company’s earlier growth phase. TURBINE-X Energy is the joint development partner for AI data center power infrastructure. And Verdant Microgrid was an early microgrid deployment partner in California, back when the whole platform was much smaller.
The Road Ahead
Eos sits at an inflection point. On the surface, this looks like a boring hardware business. Underneath, there is real backlog growth, a large and diversifying demand pipeline, a factory that is actually scaling, and a policy backdrop that currently favors domestic, non lithium chemistries. Independent analysts have floated a wide range of outcomes here, from a modest re rating if the company simply keeps executing, to a meaningfully higher valuation if pipeline conversion speeds up and margins finally turn positive.
The risks are just as real, and worth stating plainly. Eos is still losing significant money on every dollar of revenue. It remains reliant on capital markets to fund its growth. It has faced a securities fraud lawsuit tied to past manufacturing execution problems. And it depends on a fairly small number of large customers and financing partners, FPUSA among them, for near term revenue. Scaling automated battery manufacturing lines is genuinely difficult work, and Eos has stumbled on execution before.
Still, the bigger trend behind all of this is not going away anytime soon. AI driven power demand keeps climbing. The grid badly needs longer duration storage. U.S. industrial policy keeps pushing toward domestic battery manufacturing. Whether Eos ends up capturing that opportunity at real scale, or just one of several companies competing for a slice of it, probably depends less on the chemistry itself. The chemistry does appear to genuinely work. It depends more on whether the team can keep turning its growing pipeline into profitable, delivered projects.
Analyzing the gap between Planet Labs’ fundamentals and its stock price from a 268% backlog surge to Wall Street targets implying triple-digit upside.
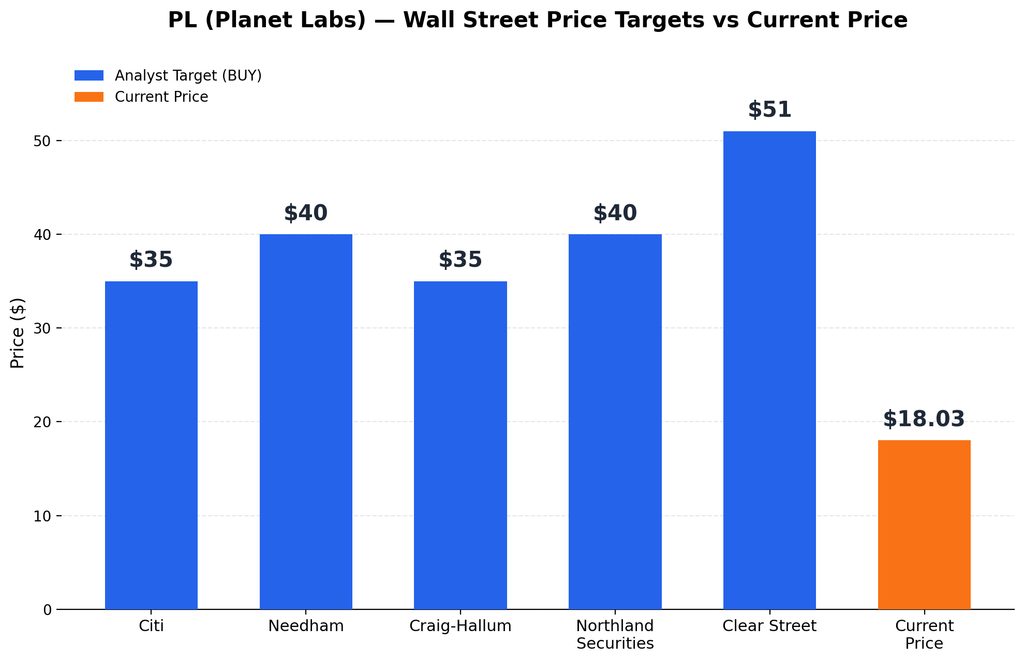
Planet Labs (NYSE: PL) has quietly built one of the most compelling setups in the small-cap space sector — and the market doesn’t seem to have caught up yet. Shares closed at $18.03 on September 5, 2026, even as five major analyst firms hold BUY ratings with price targets ranging from $35 to $51. That’s a gap of roughly 94% to 183% between where the stock trades today and where Wall Street thinks it should be.
That kind of gap usually means one of two things the market is missing something, or the story is more complicated than the headline. To figure out which, it helps to understand what Planet Labs actually does, and why it’s built differently from any other satellite company out there.
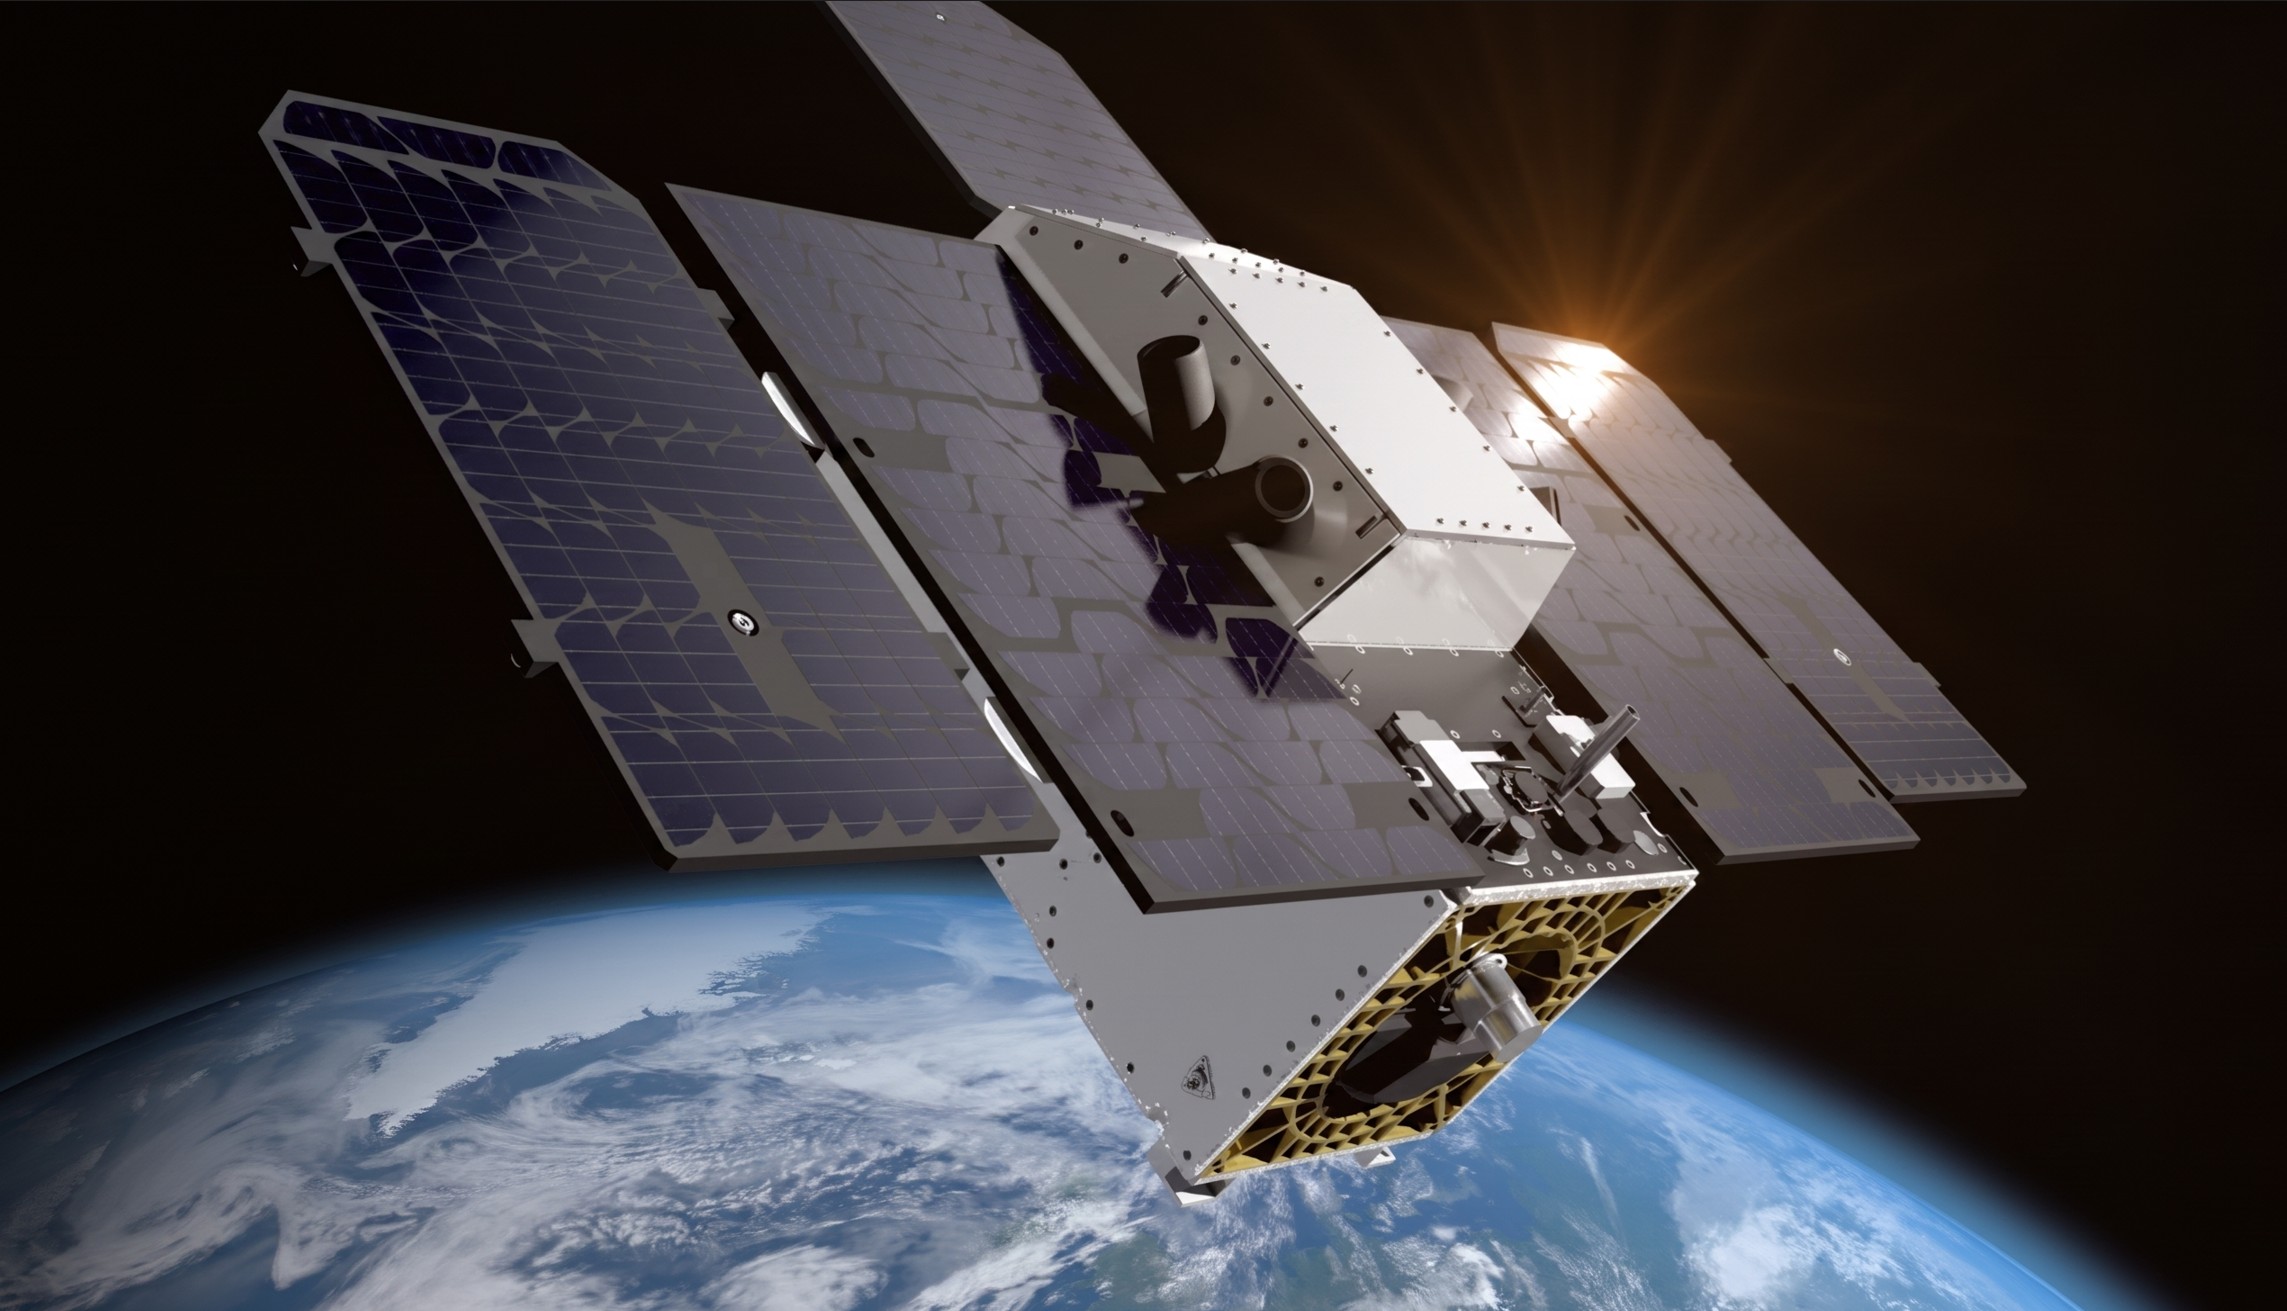
The company has launched over 460 satellites since 2013. It currently operates an active fleet of approximately 200 to 220 satellites in orbit, with 263 cameras active in space.
SuperDove: Each satellite is equipped with a 47-megapixel multispectral camera system (200 total cameras across the fleet).
SkySat: A constellation of 21 high-resolution satellites equipped with 63 total cameras.
Next-Generation Satellites:
Pelican: 10 active satellites deployed (1 camera per satellite).
Tanager: 1 active satellite deployed (1 camera per satellite).
Historically, satellites were massive and heavy, requiring significant capital and time to build and launch. Planet Labs disrupted this paradigm by pioneering a compact form factor—ranging from the size of a retail shipping box to a small appliance:
Smallest: 10 cm × 10 cm × 30 cm | 5 kg
Largest: 60 cm × 60 cm × 95 cm | 110 kg
Camera width: Under 10 cm
By comparison, traditional satellites ranged from the size of an SUV (2,000 kg) to a full-sized school bus (up to 20,000 kg).
Launch & Infrastructure Partner: SpaceX ($SPCX)
To deploy and maintain its constellation in orbit, Planet Labs relies heavily on SpaceX as its primary launch provider.
Rideshare Model: Planet utilizes SpaceX’s Falcon 9 Transporter missions, allowing dozens of compact satellites (SuperDoves, Pelican, and Tanager) to piggyback into Low Earth Orbit on a single rocket.
Rapid Replenishment: This partnership enables Planet to maintain an aggressive deployment cycle, quickly replacing de-orbited hardware and continuously upgrading fleet camera sensors without the immense capital cost of dedicated launches.
2. What They Do: Continuous Imagery Captured Every 1–2 Seconds
Planet Labs provides persistent Earth observation data across multiple industries:
Agriculture: Tracking changes in field color, crop health, pest infestations, disease spread, and optimal harvest timing.
Defense & Intelligence: Detecting missile launches, terrorist activities, territorial intrusions, nuclear tests, and military troop movements.
Geospatial Tracking: Monitoring remote or inaccessible regions, including deserts and glaciers.
Resolution Capability: High-resolution imagery captures spatial detail down to 30 cm × 30 cm per pixel, enabling the identification of vehicle shapes, makes, and colors from low Earth orbit.
3. Client Base: Government & Public Sector (80%) | Commercial Enterprises (20%)
Defense & Intelligence Agencies:
U.S. National Reconnaissance Office (NRO): Awarded Planet a multi-year Electro-Optical Commercial Layer (EOCL) contract for high-resolution imagery.
U.S. Department of Defense / NGA: Leverages daily SuperDove imagery feeds to monitor activity across airfields, maritime ports, and contested military zones.
Swedish Armed Forces (FMV): Strategic customer utilizing Pelican satellite data integrated with edge AI for real-time threat detection.
NATO & Allied Nations: Allied Command Transformation uses Planet imagery for persistent space-based surveillance and unclassified intelligence sharing among member states.
Civil & International Ministries:
NASA: Subscribes to PlanetScope data for climate research, glacier tracking, and land-use analysis.
State & Local Agencies: Fire departments and forestry services utilize real-time imagery for rapid burn-mapping during active wildfires and flood damage assessments.
Non-Profit & Policy Coalitions: Partners like Carbon Mapper leverage Tanager hyperspectral satellites to track point-source greenhouse gas emissions globally.
Agriculture & Agribusiness:
Key Clients: Corteva, Bayer, Farmers Edge.
Use Cases: Crop health monitoring, yield forecasting, drought stress detection, and field-level variable fertilizer application.
Energy, Oil & Gas:
Key Clients: Utility operators, pipeline managers, and renewable energy developers.
Use Cases: Inspecting pipeline right-of-ways for encroachments, monitoring refinery stockpiles, and detecting methane leaks via Tanager satellites.
Use Cases: Container counts at major shipping ports, oil storage tank volume estimation, and automated post-hurricane property damage claims processing.
Mapping, Tech & Logistics:
Key Clients: Google Maps and global supply chain logisticians.
Use Cases: Updating basemaps, monitoring infrastructure development, and tracking port congestion or supply chain bottlenecks.
4. Geographical Revenue Breakdown
Region
Share of Revenue
United States
40.00%
EMEA (Europe, Middle East, Africa)
22.00%
Japan
12.35%
Ukraine
11.67%
Asia-Pacific
7.09%
Latin America
3.97%
Rest of North America
2.64%
5. Contract Durations & Revenue Realization
Annual & Multi-Year Dominance: Approximately 94% of Planet’s business is generated from annual or multi-year agreements.
Average Contract Duration: ~1.5 to 2 years.
Revenue Realization Schedule:
~50% converts to revenue within 12 months.
~70% converts to revenue within 24 months.
~30% is recognized across longer multi-year horizons (3 to 5+ years).
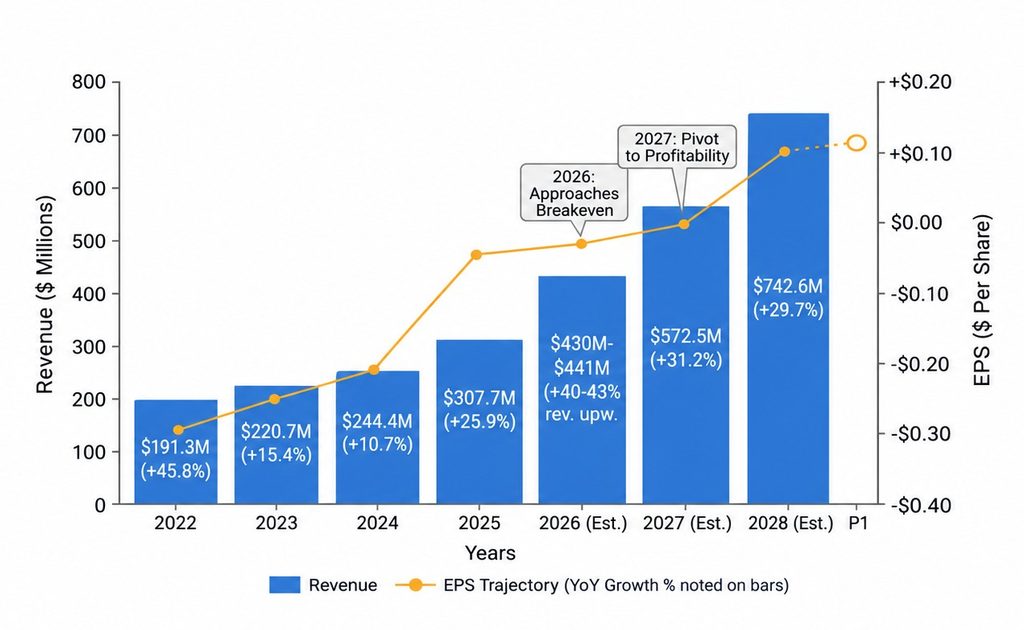
6. Revenue Trajectory (YoY Growth)
2022: $191.3M (+45.8%)
2023: $220.7M (+15.4%)
2024: $244.4M (+10.7%)
2025: $307.7M (+25.9%)
2026 (Est.): $430M–$441M (+40–43% revised upward)
2027 (Est.): $572.5M (+31.2%)
2028 (Est.): $742.6M (+29.7%)
7. EPS Trajectory
2022: -$0.31 (+16.6%)
2023: -$0.25 (+3.1%)
2024: -$0.20 (-19.5%)
2025: -$0.04 (+49.2%)
2026 (Est.): -$0.05 to $0.00 (Approaching potential breakeven)
2027 (Est.): $0.01 (Pivot to profitability)
2028 (Est.): $0.12 (+833.1%)
8. Management Guidance
Revenue: $430M to $441M
Adjusted EBITDA: $3M to $10M
Non-GAAP Gross Margin: 55% to 57%
Capital Expenditures (CapEx): $100M to $115M
9. Backlog Growth
2023: $221M (+15.7%)
2024: $244M (+10.4%)
2025: $900M (+268.8%)
2026: $815M (+11.0% YoY)
10. Client Retention (Net Dollar Retention Rate)
Net Dollar Retention (NDR):109% — Existing clients spent 9% more year-over-year, accounting for contract downgrades and churn.
NDR including Winbacks:110% — Factoring in returning former clients, net expansion reaches 110%.
11. Debt Trend (3-Year Horizon)
2023: $24.9M
2024: $21.6M
2025: $462.5M
2026: $462.6M
12. Cash Position
2023: $298.9M
2024: $249.0M
2025: $640.1M
2026: $865.4M
13. Debt-to-Equity (D/E) Ratio:1.49
14. Common Shares Outstanding
2023: 268.12M
2024: 278.94M
2025: 312.42M
2026: 363.80M
15. Major Shareholders & Ownership Structure
Alphabet Inc. (Google): 9.7% – 10.6%
Vanguard Group: 6.5% – 7.1%
BlackRock Inc.: 4.9% – 5.1%
Ownership Breakdown:
Institutional: 55% – 60%
Public / Retail: 35% – 40%
Insiders: 2% – 3%
16. Key Strategic Growth Initiative: Orbital AI Computing
Planet Labs is partnering with Google on an orbital AI computing project built around Google’s Project Suncatcher.
Objective: Evaluate whether space-based, solar-powered satellite constellations can effectively run AI hardware in low Earth orbit (LEO). The mission will test Google Tensor Processing Units (TPUs) in space for solar power efficiency, thermal dissipation, radiation tolerance, and optical inter-satellite links for high-bandwidth machine learning workloads.
Planet Labs’ Role: Utilizing its satellite manufacturing and constellation management capabilities, Planet is building two prototype demonstration satellites designed to host Google’s TPU hardware.
Target Launch: Scheduled for early 2027.
Project Status: Currently an early stage R&D moonshot rather than an active commercial revenue driver but one worth watching.
17. Wall Street Price Targets
Citi: $35 (BUY)
Needham: $40 (Adjusted from $53, BUY)
Craig-Hallum: $35 (Adjusted from $49, BUY)
Northland Securities: $40 (Adjusted from $50, BUY)
Clear Street: $51 (Adjusted from $53, BUY)
Disclosure: The author holds a long position in $PL stock at the time of writing.