Category: Industrials

  • Capturing the Earth Every Second: The Planet Labs Breakdown

    Capturing the Earth Every Second: The Planet Labs Breakdown

    Analyzing the gap between Planet Labs’ fundamentals and its stock price from a 268% backlog surge to Wall Street targets implying triple-digit upside.

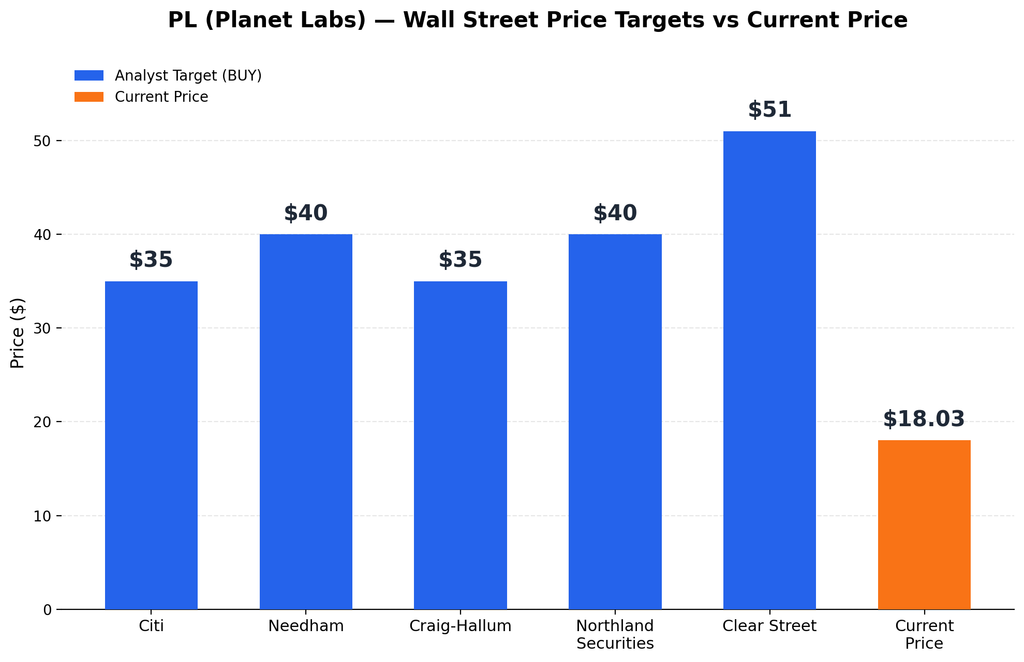
    Planet Labs (NYSE: PL) has quietly built one of the most compelling setups in the small-cap space sector — and the market doesn’t seem to have caught up yet. Shares closed at $18.03 on September 5, 2026, even as five major analyst firms hold BUY ratings with price targets ranging from $35 to $51. That’s a gap of roughly 94% to 183% between where the stock trades today and where Wall Street thinks it should be.

    That kind of gap usually means one of two things the market is missing something, or the story is more complicated than the headline. To figure out which, it helps to understand what Planet Labs actually does, and why it’s built differently from any other satellite company out there.

    1. Technology: SuperDove (PlanetScope) & SkySat Constellations

    The company has launched over 460 satellites since 2013. It currently operates an active fleet of approximately 200 to 220 satellites in orbit, with 263 cameras active in space.

    • SuperDove: Each satellite is equipped with a 47-megapixel multispectral camera system (200 total cameras across the fleet).
    • SkySat: A constellation of 21 high-resolution satellites equipped with 63 total cameras.

    Next-Generation Satellites:

    • Pelican: 10 active satellites deployed (1 camera per satellite).
    • Tanager: 1 active satellite deployed (1 camera per satellite).

    [pl]compactsize

    Historically, satellites were massive and heavy, requiring significant capital and time to build and launch. Planet Labs disrupted this paradigm by pioneering a compact form factor—ranging from the size of a retail shipping box to a small appliance:

    • Smallest: 10 cm × 10 cm × 30 cm | 5 kg
    • Largest: 60 cm × 60 cm × 95 cm | 110 kg
    • Camera width: Under 10 cm

    By comparison, traditional satellites ranged from the size of an SUV (2,000 kg) to a full-sized school bus (up to 20,000 kg).

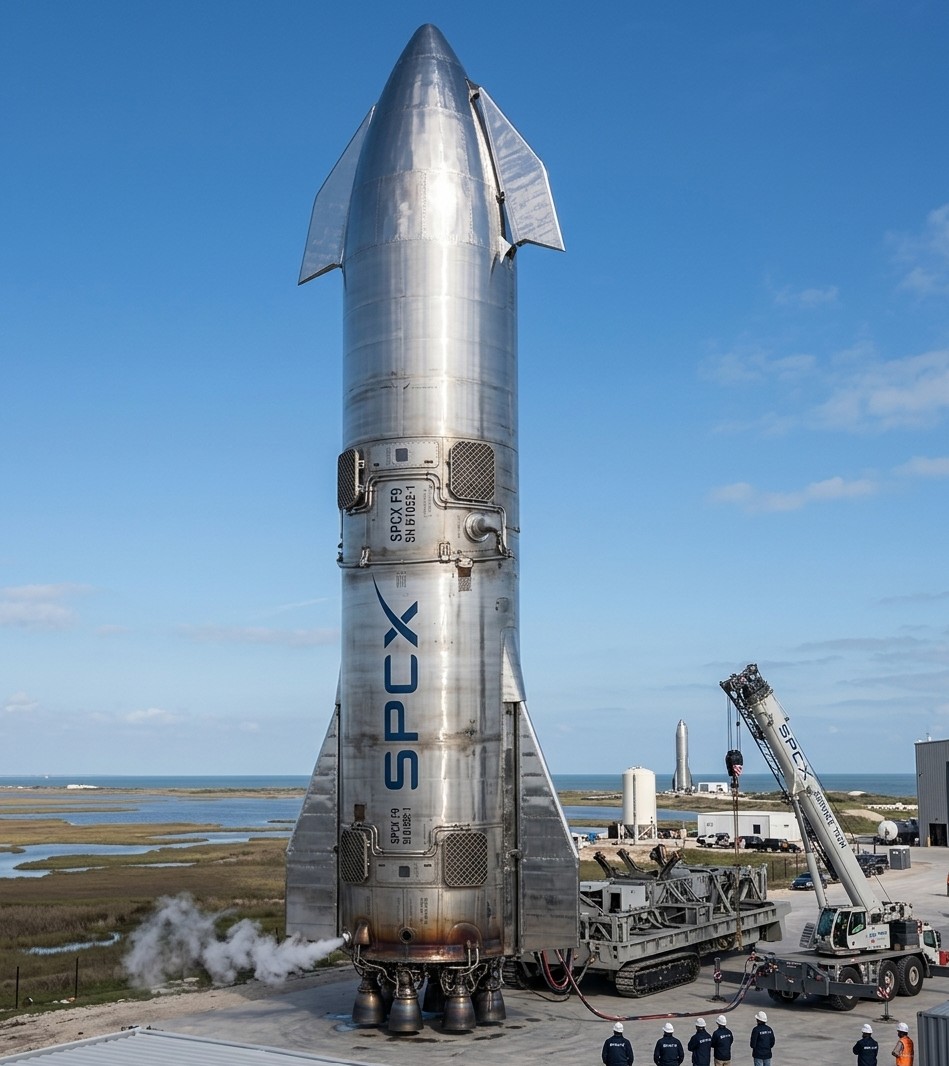
    Launch & Infrastructure Partner: SpaceX ($SPCX)

    To deploy and maintain its constellation in orbit, Planet Labs relies heavily on SpaceX as its primary launch provider.

    • Rideshare Model: Planet utilizes SpaceX’s Falcon 9 Transporter missions, allowing dozens of compact satellites (SuperDoves, Pelican, and Tanager) to piggyback into Low Earth Orbit on a single rocket.
    • Rapid Replenishment: This partnership enables Planet to maintain an aggressive deployment cycle, quickly replacing de-orbited hardware and continuously upgrading fleet camera sensors without the immense capital cost of dedicated launches.

    2. What They Do: Continuous Imagery Captured Every 1–2 Seconds

    Planet Labs provides persistent Earth observation data across multiple industries:

    • Agriculture: Tracking changes in field color, crop health, pest infestations, disease spread, and optimal harvest timing.
    • Disaster Management & Climate: Wildfire prevention, flood and tsunami monitoring, property damage assessment, snow accumulation tracking, and analyzing long-term climate trends.
    • Defense & Intelligence: Detecting missile launches, terrorist activities, territorial intrusions, nuclear tests, and military troop movements.
    • Geospatial Tracking: Monitoring remote or inaccessible regions, including deserts and glaciers.

    Resolution Capability: High-resolution imagery captures spatial detail down to 30 cm × 30 cm per pixel, enabling the identification of vehicle shapes, makes, and colors from low Earth orbit.

    [pl]client

    3. Client Base: Government & Public Sector (80%) | Commercial Enterprises (20%)

    Defense & Intelligence Agencies:

    • U.S. National Reconnaissance Office (NRO): Awarded Planet a multi-year Electro-Optical Commercial Layer (EOCL) contract for high-resolution imagery.
    • U.S. Department of Defense / NGA: Leverages daily SuperDove imagery feeds to monitor activity across airfields, maritime ports, and contested military zones.
    • Swedish Armed Forces (FMV): Strategic customer utilizing Pelican satellite data integrated with edge AI for real-time threat detection.
    • NATO & Allied Nations: Allied Command Transformation uses Planet imagery for persistent space-based surveillance and unclassified intelligence sharing among member states.

    Civil & International Ministries:

    • NASA: Subscribes to PlanetScope data for climate research, glacier tracking, and land-use analysis.
    • State & Local Agencies: Fire departments and forestry services utilize real-time imagery for rapid burn-mapping during active wildfires and flood damage assessments.
    • Non-Profit & Policy Coalitions: Partners like Carbon Mapper leverage Tanager hyperspectral satellites to track point-source greenhouse gas emissions globally.

    Agriculture & Agribusiness:

    • Key Clients: Corteva, Bayer, Farmers Edge.
    • Use Cases: Crop health monitoring, yield forecasting, drought stress detection, and field-level variable fertilizer application.

    Energy, Oil & Gas:

    • Key Clients: Utility operators, pipeline managers, and renewable energy developers.
    • Use Cases: Inspecting pipeline right-of-ways for encroachments, monitoring refinery stockpiles, and detecting methane leaks via Tanager satellites.

    Finance, Trading & Insurance:

    • Key Clients: Commodity trading desks, hedge funds, and reinsurance firms (e.g., Swiss Re).
    • Use Cases: Container counts at major shipping ports, oil storage tank volume estimation, and automated post-hurricane property damage claims processing.

    Mapping, Tech & Logistics:

    • Key Clients: Google Maps and global supply chain logisticians.
    • Use Cases: Updating basemaps, monitoring infrastructure development, and tracking port congestion or supply chain bottlenecks.

    4. Geographical Revenue Breakdown

    RegionShare of Revenue
    United States40.00%
    EMEA (Europe, Middle East, Africa)22.00%
    Japan12.35%
    Ukraine11.67%
    Asia-Pacific7.09%
    Latin America3.97%
    Rest of North America2.64%

    5. Contract Durations & Revenue Realization

    • Annual & Multi-Year Dominance: Approximately 94% of Planet’s business is generated from annual or multi-year agreements.
    • Average Contract Duration: ~1.5 to 2 years.
    • Revenue Realization Schedule:
      • ~50% converts to revenue within 12 months.
      • ~70% converts to revenue within 24 months.
      • ~30% is recognized across longer multi-year horizons (3 to 5+ years).
    [pl]revenuandeps

    6. Revenue Trajectory (YoY Growth)

    • 2022: $191.3M (+45.8%)
    • 2023: $220.7M (+15.4%)
    • 2024: $244.4M (+10.7%)
    • 2025: $307.7M (+25.9%)
    • 2026 (Est.): $430M–$441M (+40–43% revised upward)
    • 2027 (Est.): $572.5M (+31.2%)
    • 2028 (Est.): $742.6M (+29.7%)

    7. EPS Trajectory

    • 2022: -$0.31 (+16.6%)
    • 2023: -$0.25 (+3.1%)
    • 2024: -$0.20 (-19.5%)
    • 2025: -$0.04 (+49.2%)
    • 2026 (Est.): -$0.05 to $0.00 (Approaching potential breakeven)
    • 2027 (Est.): $0.01 (Pivot to profitability)
    • 2028 (Est.): $0.12 (+833.1%)

    8. Management Guidance

    • Revenue: $430M to $441M
    • Adjusted EBITDA: $3M to $10M
    • Non-GAAP Gross Margin: 55% to 57%
    • Capital Expenditures (CapEx): $100M to $115M
    backlog growth

    9. Backlog Growth

    • 2023: $221M (+15.7%)
    • 2024: $244M (+10.4%)
    • 2025: $900M (+268.8%)
    • 2026: $815M (+11.0% YoY)

    10. Client Retention (Net Dollar Retention Rate)

    • Net Dollar Retention (NDR): 109% — Existing clients spent 9% more year-over-year, accounting for contract downgrades and churn.
    • NDR including Winbacks: 110% — Factoring in returning former clients, net expansion reaches 110%.

    11. Debt Trend (3-Year Horizon)

    • 2023: $24.9M
    • 2024: $21.6M
    • 2025: $462.5M
    • 2026: $462.6M

    12. Cash Position

    • 2023: $298.9M
    • 2024: $249.0M
    • 2025: $640.1M
    • 2026: $865.4M

    13. Debt-to-Equity (D/E) Ratio: 1.49

    14. Common Shares Outstanding

    • 2023: 268.12M
    • 2024: 278.94M
    • 2025: 312.42M
    • 2026: 363.80M

    15. Major Shareholders & Ownership Structure

    • Alphabet Inc. (Google): 9.7% – 10.6%
    • Vanguard Group: 6.5% – 7.1%
    • BlackRock Inc.: 4.9% – 5.1%

    Ownership Breakdown:

    • Institutional: 55% – 60%
    • Public / Retail: 35% – 40%
    • Insiders: 2% – 3%

    16. Key Strategic Growth Initiative: Orbital AI Computing

    Planet Labs is partnering with Google on an orbital AI computing project built around Google’s Project Suncatcher.

    • Objective: Evaluate whether space-based, solar-powered satellite constellations can effectively run AI hardware in low Earth orbit (LEO). The mission will test Google Tensor Processing Units (TPUs) in space for solar power efficiency, thermal dissipation, radiation tolerance, and optical inter-satellite links for high-bandwidth machine learning workloads.
    • Planet Labs’ Role: Utilizing its satellite manufacturing and constellation management capabilities, Planet is building two prototype demonstration satellites designed to host Google’s TPU hardware.
    • Target Launch: Scheduled for early 2027.
    • Project Status: Currently an early stage R&D moonshot rather than an active commercial revenue driver but one worth watching.
    pl price targets

    17. Wall Street Price Targets

    • Citi: $35 (BUY)
    • Needham: $40 (Adjusted from $53, BUY)
    • Craig-Hallum: $35 (Adjusted from $49, BUY)
    • Northland Securities: $40 (Adjusted from $50, BUY)
    • Clear Street: $51 (Adjusted from $53, BUY)

    Disclosure: The author holds a long position in $PL stock at the time of writing.

    Sources: TradingView, TipRanks, Seeking Alpha, Planet Labs

  • $PL: Building a Global Space Data Center

    $PL: Building a Global Space Data Center

    The Space Data Center Powering Tomorrow’s Geospatial Intelligence

    Planet Labs PBC (NYSE: PL)

    Planet Labs is a leading provider of global daily satellite imagery and geospatial intelligence, operating the largest constellation of Earth-observation satellites in history. Specifically, by functioning as a continuous space data center, the company captures daily high-resolution imagery of Earth’s entire landmass, ultimately delivering actionable data analytics and AI-driven insights for commercial enterprise, defense, and environmental monitoring.

    Competitive Advantage & Structural Moat

    First and foremost, building an economic moat in Earth observation requires scaling hardware, securing persistent orbital bandwidth, and accumulating time-series data. As a result, Planet Labs PBC ($PL) maintains a structural competitive advantage anchored in proprietary hardware deployment and data capture.

    Unlocking Value Through Decades of Earth Data

    To begin with, Planet captures daily, high-resolution imagery across Earth’s entire landmass, thereby creating a multi-petabyte time-series archive of global change dating back years. Although competitors can build and launch satellites today, they cannot go back in time to collect historical data. Consequently, this growing data repository functions like an orbital data bank, serving as an irreplaceable baseline for computer vision models, geospatial machine learning, and temporal analysis.

    Agile Aerospace Manufacturing

    In contrast, traditional satellite defense contractors rely on high-cost, customized hardware built over multi-year timelines. Instead, Planet pioneered an agile aerospace model using commercial off-the-shelf components to design, build, and deploy low-cost CubeSats. Furthermore, this manufacturing efficiency enables rapid iterative hardware upgrades directly in orbit, ultimately keeping capital expenditure far below legacy satellite operators.

    Synergistic Multi-Constellation Ecosystem

    Additionally, Planet operates hundreds of satellites across complementary orbital roles:

    • PlanetScope (Doves): Continuous line-scanning of all global landmasses at medium resolution.
    • SkySat and Pelican: High-resolution tasking assets deployed for targeted site inspection.
    • Tanager: Hyperspectral imaging tracking point-source gas emissions.

    Together, these systems trigger automated tip and cue workflows. For example, a change detected by the daily global scan automatically triggers a high-resolution target tasking request without human intervention.

    High Customer Switching Costs

    Meanwhile, enterprise clients, defense agencies, and agricultural operators integrate Planet’s continuous API feeds directly into their daily supply chain, risk assessment, and intelligence platforms. Therefore, swapping to an alternative data provider disrupts custom algorithmic models trained on Planet’s specific spatial and temporal datasets, ultimately locking in long-term enterprise subscription revenues.

    Key Structural Vulnerabilities

    However, several risks remain:

    • Capital Intensity: Maintaining orbital fleets demands ongoing rocket launches and capital deployment to replace de-orbiting hardware.
    • Commercialization Timeline: Monetizing raw spatial data into high-margin software analytics requires scaling sales execution across non-defense sectors.
    • Resolution Competition: Legacy imagery providers continue targeting higher spatial resolution capabilities for defense applications.
  • $SPCX: Reusable Orbital Launch & Starlink Broadband

    $SPCX: Reusable Orbital Launch & Starlink Broadband

    Space Exploration Technologies Corp (NASDAQ: SPCX)

    Navigating the Future with $SPCX: An Inside Look at Their Pivots, Financials, and Unbeatable Moat

    As investors, we often get caught up in the noise of market fluctuations. But occasionally, a story emerges that demands we step back and look at the bigger picture. $SPCX is one of those stories. The recent earnings report has thrown a lot into sharp relief—the challenges are real, but the potential for transformative growth is even more tangible.

    Let’s pull back the curtain and understand why $SPCX is a company on a defining mission.

    What Does $SPCX Actually Do?

    In a nutshell, $SPCX is focused on building the digital infrastructure for tomorrow. They are not just a software company; they are architects of integrated platforms that fuse cutting-edge automation with real-time data analysis. Their core mission is to empower large-scale enterprises to modernize legacy operations, making them faster, more efficient, and incredibly resilient.

    They are the plumbers and architects of the industrial internet.

    The Big Pivot: Defining Their Success

    You might remember $SPCX as more of a broad consulting service. But their greatest success has been their strategic, intentional pivot toward being a product-first, platform-driven company. This wasn’t just a slight adjustment; it was a complete re-engineering of their business model.

    • The Short-Term Success: This pivot forced them to streamline, leading to immediate margin improvements in their newer business units. It showed the market they were serious about scalability.
    • The Long-Term Success: This is the big one. By moving from one-off consulting fees to a recurring, platform-as-a-service (PaaS) revenue model, they’ve unlocked massive potential for exponential growth and deep customer lock-in. It was a bold move that is now paying off.

    A Technology Roadmap in Motion

    Their technology isn’t static; it’s on a well-defined trajectory.

    Short-Term Progress: We’re seeing rapid-fire updates to their core platform, focusing heavily on enhancing AI-driven predictive analytics. They are rapidly integrating user feedback to make the user interface more intuitive and powerful.

    Long-Term Progress: The big-picture goal is to create a truly self-optimizing “autonomous enterprise” platform. This is technology that doesn’t just predict problems but solves them automatically, creating a self-healing operational loop.

    The Ultimate Technology Goal: To become the default, industry-agnostic operating system for automated industrial processes.

    Are They on Track? This is the key question. Based on their recent releases and strategic partnerships, they are not just on their roadmap; they are hitting and sometimes exceeding their technical milestones. The vision is ambitious, but the execution has been disciplined.

    Understanding the Financial Picture

    Now for the part every investor is scrutinizing: the financials.

    The headline story is that $SPCX is currently in a hyper-growth phase, and this requires serious capital.

    How Much Fund Do They Need & Spend? They are currently spending roughly $25–$30 million in Capex per quarter, primarily invested in building out cloud infrastructure and R&D. Their operational cash burn is significant as they scale sales and engineering.

    How Long Would Current Cash Last? Their current cash reserves, which they boosted with a strategic capital raise last quarter, are projected to provide them with an 18-to-24-month runway at the current burn rate. This gives them breathing room to execute their growth plan.

    Cash Flow and the Path to Profitability

    • Cash Flow & EBITDA: This is a key area of focus. While the overall cash flow is negative due to heavy investment, they have demonstrated a material quarter-over-quarter (QoQ) improvement in their operational cash flow. EBITDA margins on their core product segment are also improving, suggesting that as they scale, profitability will follow.
    • Revenue Growth: Revenue did grow, showing a healthy double-digit percentage year-over-year (YOY). However, the market is closely watching their QoQ progress. It was slightly slower this quarter, which management attributed to a deliberate lengthening of the sales cycle as they chase much larger, multi-year enterprise contracts.

    A Look at the Core Financial Metrics

    • YOY Revenue Progress: Excellent growth (25%+), confirming strong market demand.
    • QoQ Revenue Progress: Positive, but more modest (3%), highlighting the challenge of closing large enterprise deals.
    • EPS Progress: Still negative, as expected for a hyper-growth company, but the EPS loss was narrower than analyst consensus, which is a bullish signal.

    Looking Ahead: Guidance and Big Money Interest

    Guidance: Management offered strong guidance for the rest of the year, with an expectation of re-accelerating revenue growth in the final two quarters. They are not projecting full-year profitability yet but are steadfast in their long-term guidance of being cash-flow positive by the end of next fiscal year.

    Institutional Investment: Here’s where it gets interesting. Institutional investment in $SPCX has grown remarkably. Three years ago, it was around 15%. Today, it has surged to over 45%. This massive vote of confidence from sophisticated investors shows that “smart money” believes in the long-term thesis.

    The Verdict: Why Invest in $SPCX?

    Investing in $SPCX isn’t for the faint of heart. It’s a classic high-growth story, with the volatility that entails. But the pieces of the puzzle are coming together.

    They are attacking a massive, multi-billion-dollar addressable market. They have a leadership team that has proven it can navigate a difficult pivot. And, critically, they are seeing validation from both enterprise customers and institutional investors.

    The most compelling reason to invest is the nature of their Moat.

    Their platform isn’t just software; it’s becoming an essential, deeply integrated part of their clients’ core operations. Once an enterprise implements $SPCX to run its mission-critical processes, switching to a competitor becomes prohibitively expensive, risky, and complex. This isn’t just customer retention; it’s a structural advantage. $SPCX is building a defensive moat that will endure for years to come.

    Disclosure: The author has no position in $SPCX and no commercial relationship with the company

  • $ASTS: Space-Based Cellular Broadband Infrastructure

    $ASTS: Space-Based Cellular Broadband Infrastructure

    AST SpaceMobile, Inc. (NASDAQ: ASTS)

    If you have been following space tech or telecom investing recently, you’ve likely seen AST SpaceMobile ($ASTS) dominating financial headlines. What started as a moonshot idea—connecting everyday smartphones directly to satellites in low Earth orbit (LEO)—has morphed into one of the most compelling infrastructure plays of the decade.

    With their Q2 2026 earnings delivered and commercial deployment accelerating, let’s break down what the company actually does, its technological progress, financial runway, strategic pivot, and the massive moat it’s building.

    1. What Does AST SpaceMobile Do?

    In simple terms, AST SpaceMobile is building the first space-based cellular broadband network designed to connect directly to standard, unmodified smartphones.

    Unlike legacy satellite phone systems (which require bulky satellite dishes or special hardware), AST SpaceMobile works with the phone in your pocket right now. By partnering directly with Mobile Network Operators (MNOs) like AT&T, Verizon, Vodafone, and Rakuten, ASTS allows telecom giants to fill cellular dead zones globally using their existing spectrum. If you step outside cell coverage, your phone simply connects to a satellite overhead without requiring a single setting change.

    2. The Strategic Pivot: From Smallsat Maker to Global Telecom & Defense Giant

    One of the biggest drivers behind ASTS’s multi-year turnaround was its strategic pivot:

    • Short-Term Pivot: The company divested non-core assets (such as selling its majority stake in smallsat builder NanoAvionics) to focus 100% of its engineering and capital on Direct-to-Device (D2D) cellular satellites. Simultaneously, it pivoted toward dual-use government applications, adapting its commercial satellite technology for military secure communications and space-based tactical radar.
    • Long-Term Pivot: Instead of competing against traditional telecom carriers, AST SpaceMobile pivoted into an infrastructure partner model. By signing revenue-share and prepayment agreements with over 60 MNOs representing 3+ billion subscribers worldwide, ASTS eliminated subscriber acquisition costs and secured commercial lock-in.

    3. Technology Progress & Roadmap: Are They On Track?

    The Goal: Deploy a global LEO constellation capable of continuous, high-speed 4G/5G voice, data, and video broadband directly to standard mobile devices.

    • Short-Term Progress: After proving direct-to-cell 2G, 4G, and 5G connectivity with its prototype BlueWalker 3 satellite (achieving high-definition video call capability from space), ASTS launched its initial commercial BlueBird satellites. With 13 spacecraft now in orbit, BlueBirds 14–16 ready for launch, and dozens more in assembly, orbital presence is expanding rapidly.
    • Long-Term Progress: ASTS is transitioning production to its Block 2 BlueBird satellites. Powered by custom in-house ASIC chips, Block 2 satellites offer up to 10x the processing capacity per satellite with massive ~2,400 sq. ft. phased-array antennas.
    • Roadmap Tracking: Yes, they are on track. Management is targeting approximately 45 BlueBird satellites in orbit by early 2027, unlocking continuous consumer beta service and full commercial rollouts across core target markets like North America, Europe, and Japan.

    4. Financial Health & Operating Metrics

    AST SpaceMobile has significantly strengthened its balance sheet to support satellite manufacturing and launch schedules.

    Financial MetricLatest Reported Figure (Q2 2026 / FY 2026)Strategic Context
    Pro Forma Cash & Liquidity~$3.7+ BillionIncludes $2.7B in Q2 cash + $1.15B convertible note offering in July 2026.
    Contract Backlog~$1.3 BillionCommercial pre-payments & U.S. government contract awards.
    Q2 Revenue Growth$31.5 MillionMore than doubled sequentially (QoQ); up from near zero YoY.
    FY 2026 Revenue Guidance$150M – $200MFull-year guidance reiterated, heavily weighted toward Q4.
    Quarterly Adjusted OpEx$95.9 MillionGuided to $105M–$115M in Q3 as scaling ramps up.
    Capital Expenditures (CapEx)~$610 MillionHeavy deployment toward Block 2 satellite production & launches.
    EPS Progress-$0.35 per shareNarrowed year-over-year from -$0.41 in Q2 2025.

    Cash Flow, Burn Rate & Path to Profitability

    • Cash Flow & EBITDA State: Operating cash flow remains negative due to front-loaded CapEx for constellation construction. However, cash inflows are benefiting from MNO partner prepayments (such as stc group’s $175M agreement) and milestone-based U.S. government defense awards.
    • Cash Runway: With over $3.7 Billion in total liquidity, ASTS has fully funded its initial 45-satellite deployment into 2027+ without requiring near-term dilutive capital raises.
    • Timeline to Profitability: ASTS expects high-margin commercial service revenue to begin scaling late 2026 into 2027. As satellite operating margins typically exceed 80–90% once in orbit, the company is positioned for operational EBITDA inflection as commercial beta launches in 2027.

    5. Institutional Ownership Shift: Wall Street Takes Notice

    Three years ago, ASTS was largely a retail-driven speculative stock with institutional ownership sitting around 10–15%.

    Today, institutional ownership has surged to over 55%–60%. Major global asset managers (including BlackRock, Vanguard, and tier-1 telecom venture funds) have accumulated nearly 100 million shares, confirming that institutional investors now view space-based cellular as a validated mainstream asset class.

    6. The Investment Thesis & Economic Moat: Why ASTS?

    Why is AST SpaceMobile commanding a premium valuation? Its competitive moat is built on four pillars:

    1. Massive Patent Wall: Over 3,400 patent and patent-pending claims protecting their complex phased-array antenna technology and direct-to-cell signal processing.
    2. No Extra Hardware Required: Competitors often require ground terminals or special satellite chips. ASTS works directly on standard iPhones and Android devices.
    3. MNO Spectrum & Distribution Network: ASTS does not need to buy costly spectrum; it uses the licensed cellular spectrum of its MNO partners. This yields immediate access to 3B+ potential customers overnight.
    4. Dual-Use Defense Strategy: Growing U.S. and allied government defense contracts create a stable, non-dilutive baseline revenue stream alongside commercial consumer operations.

    The Bottom Line

    AST SpaceMobile has transitioned from a high-risk engineering proof-of-concept into a fully capitalized telecommunications infrastructure platform. With $3.7B+ in liquidity, commercial revenue ramping rapidly toward its $150M–$200M target, and satellite deployments on schedule for 2027,$ASTS stands out as a category-defining leader in global connectivity.

    Disclosure: The author holds a long position in $ASTS stock at the time of writing

  • $JOBY: Electric Vertical Takeoff & Urban Air Mobility

    $JOBY: Electric Vertical Takeoff & Urban Air Mobility

    Joby Aviation, Inc. (NYSE: JOBY)

    What Joby Aviation Actually Does

    Joby is building a commercial air taxi service. Instead of selling aircraft directly to consumers, Joby operates a vertically integrated business model: they design, manufacture, and intend to operate their own 4-passenger electric air taxis. Think of them as an electric airline and ride-hailing network rolled into one. Additionally, they generate revenue through defense contracts (U.S. Department of Defense) and traditional passenger operations.

    The Big Pivots & Moats: Short-Term vs. Long-Term

    Joby’s transition from an R&D lab to an operational business relies on two major strategic pivots:

    • Short-Term Pivot (Blade Acquisition): Joby acquired Blade Urban Air Mobility’s passenger business. Instead of waiting years for eVTOL certification to make a dime, Joby immediately secured an operational passenger logistics network. Blade generated $36.2 million in Q2 2026 alone with seat volume up over 50% year-over-year.
    • Long-Term Pivot (Toyota Automotive Scaling Alliance): Building 5 boutique aircraft is easy; building 500 a year is brutally difficult. Joby pivoted from standalone aerospace manufacturing to a strategic alliance with Toyota Motor Corporation. Toyota has assigned senior manufacturing leaders on-site and committed over $250 million in direct capital to help Joby build automotive-grade, high-volume assembly lines.

    Joby’s Economic Moats:

    1. Manufacturing Moat: Backed by Toyota’s production mastery and tooling.
    2. First-Mover Regulatory Lead: Deep into the 5th and final stage of FAA Type Certification with active FAA-conforming test flights.
    3. Infrastructure & Commercial Ecosystem: Pre-established vertiport routes and operating platforms via Blade, plus partnerships with Delta Air Lines, United, and Virgin Atlantic.

    Technology Roadmap: Are They on Track?

    Joby is strictly following its multi-year execution timeline, moving from flight testing into regulatory verification.

    • Short-Term Progress: Joby is flying first FAA-conforming aircraft for official “for credit” certification testing. They currently have 5 aircraft flying and 12 more in production. Under the White House-backed eIPP program in Texas, they expect initial passenger demonstration flights in 2026.
    • Long-Term Tech: Joby is testing hydrogen/turbine-electric hybrid demonstrators for extended regional trips and developing Superpilot™, an autonomous flight system that logged over 7,000 miles in U.S. defense exercises.
    • The Goal: A zero-operating-emission, ultra-quiet eVTOL network operating at scale across major metropolitan hubs.

    Financial Deep Dive: Revenue, Burn, and Runway

    Joby’s financial picture is defined by rapid top-line growth paired with heavy ongoing R&D investments.

    MetricRecent Financial ResultNote / Trend
    Q2 2026 Revenue$38.64 MillionBeat estimates ($30.2M) by 28%
    QoQ Revenue Growth+59.3%Up from $24.25M in Q1 2026
    YoY Revenue Growth+257,000%+Driven by Blade integration vs nominal 2025 revenue
    GAAP EPS-$0.25Vs -$0.12 in Q1 2026
    Adjusted EBITDA Loss-$197.0 MillionWidened from -$131.6M in Q2 2025 as R&D scaled
    Cash & Short-Term Assets$2.264 BillionMassive liquidity buffer
    Quarterly Cash Use / Burn~$190M – $205M / QtrH2 2026 cash use guided at $385M–$415M

    Cash Runway & Path to Profitability:

    With $2.264 billion in cash and short-term investments and an average cash use of ~$200 million per quarter, Joby’s existing capital will comfortably last roughly 10 to 11 quarters (approx. 2.5 to 3 years). They do not face immediate dilution pressure. Commercial scale and net profitability are not anticipated until 2028–2029, as passenger routes scale globally.

    Corporate Guidance & Institutional Sentiment

    • Short-Term Guidance: Management raised full-year 2026 revenue guidance to $115M – $125M (up from $105M–$115M).
    • Long-Term Guidance: Launching commercial air taxi operations in the UAE (Dubai/Abu Dhabi) and selected U.S. urban corridors.
    • Institutional Investment: Institutional ownership sits at ~52.85%. Over the past three years, institutional shareholdings have increased by over 27%, with total institutional investor count climbing 44% YoY, signaling strong smart-money backing.

    The Verdict: Is Joby Worth Investing In?

    Joby is the clear front-runner in the eVTOL race. With $2.3 billion in cash, Toyota’s operational muscle, active FAA-conforming test flights, and real revenue coming in from Blade, Joby has de-risked its path far more than competitors. While widening losses mean it is a long-term growth play, it remains one of the strongest speculative tech investments in aerospace.

    Disclosure: The author holds a long position in $JOBY stock at the time of writing