S&P 500 Valuation 2026 Still Has Room to Run
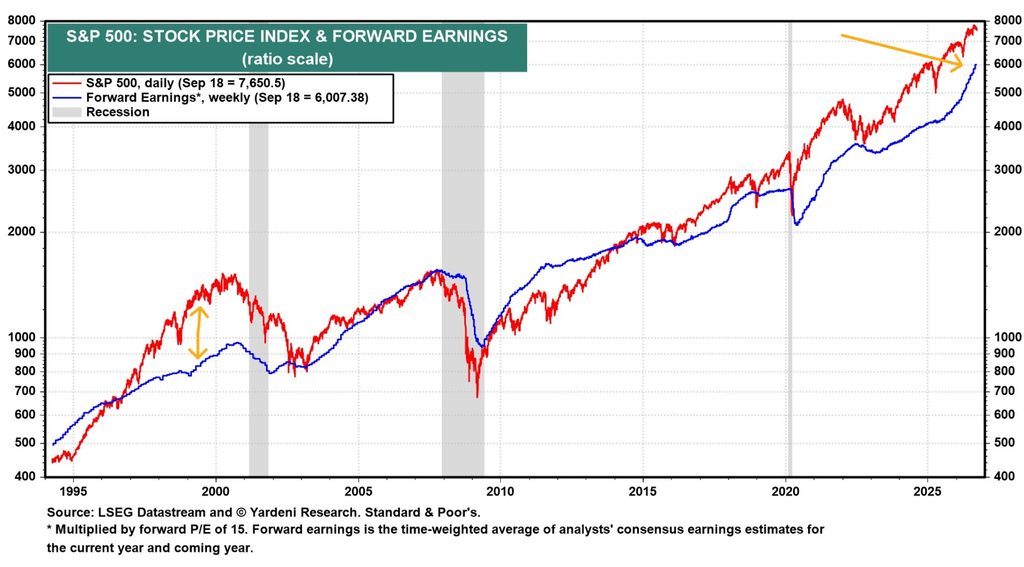
Earnings Are Rising as Fast as Price
The recent pullback in the S&P 500 has sparked debate about whether stocks are overextended. A look at forward earnings tells a more constructive story. Since 2023, price and earnings have climbed at a similar steep angle. Forward earnings sit at 6,007 as of September 18, up sharply from around 3,400 a few years earlier. The S&P 500 price index sits at 7,650.5 over the same period.
This differs from the run up to 2000. Back then, forward earnings flattened near 900 while price kept pushing past 1,500. That gap was the real warning sign. Today the two lines are moving together. When price and earnings rise in tandem, the multiple does not need to expand to justify new highs.
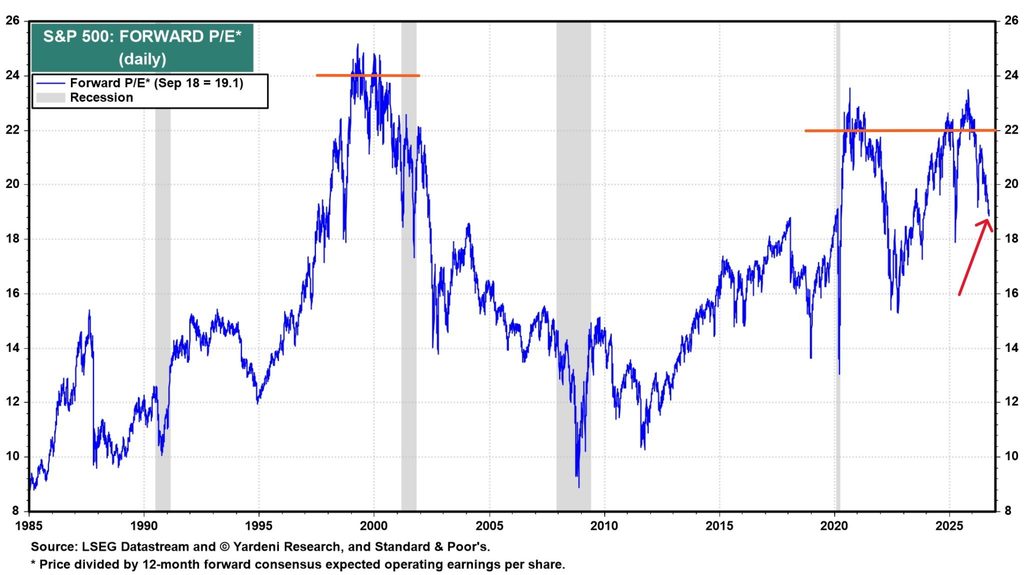
The Forward Multiple Sits Below Recent Peaks
The forward P/E is currently 19.1. That is well below the 2025 peak near 23 and below the 24x level reached in 1999 and 2000. It sits closer to levels seen through 2015 to 2018, a stretch generally viewed as a normal bull market.
A pullback in the multiple while earnings keep climbing is a healthy combination. It suggests the recent correction reflects a cooling in sentiment rather than a break in the earnings trend.
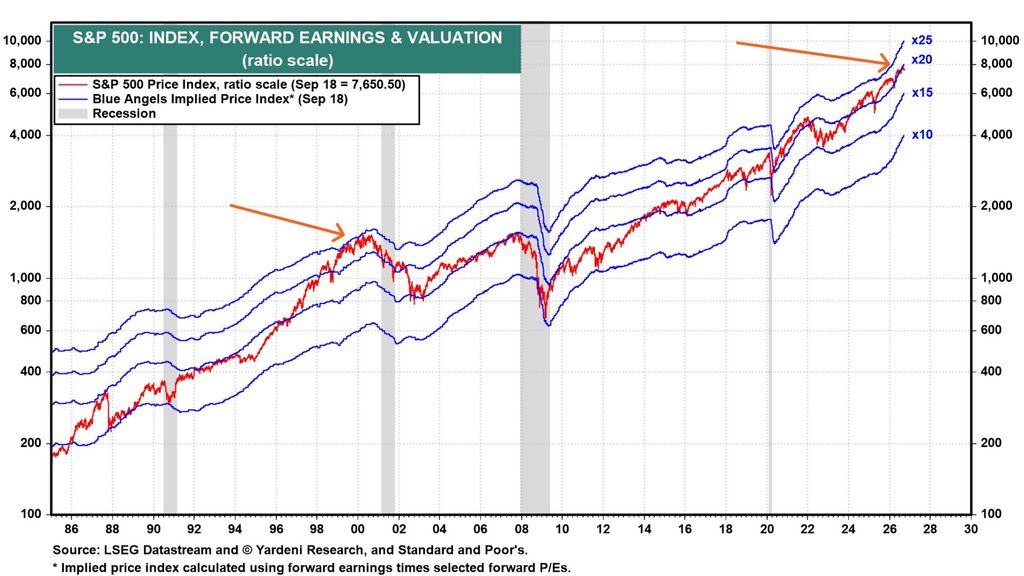
Price Sits Inside a Reasonable Valuation Band
This chart plots the S&P 500 against implied price levels at forward multiples from 10x to 25x earnings. The index currently sits between the 15x and 20x lines. It is not pressing against the 25x line, which is where price traded briefly at the 2000 and 2021 peaks.
In the past, once price pushed into that top band while earnings failed to keep pace, sharp corrections followed. That is not the current setup. Earnings are rising fast enough that price has room within its current band, even without further multiple expansion.
Spending and Cash Flow Are Moving Together
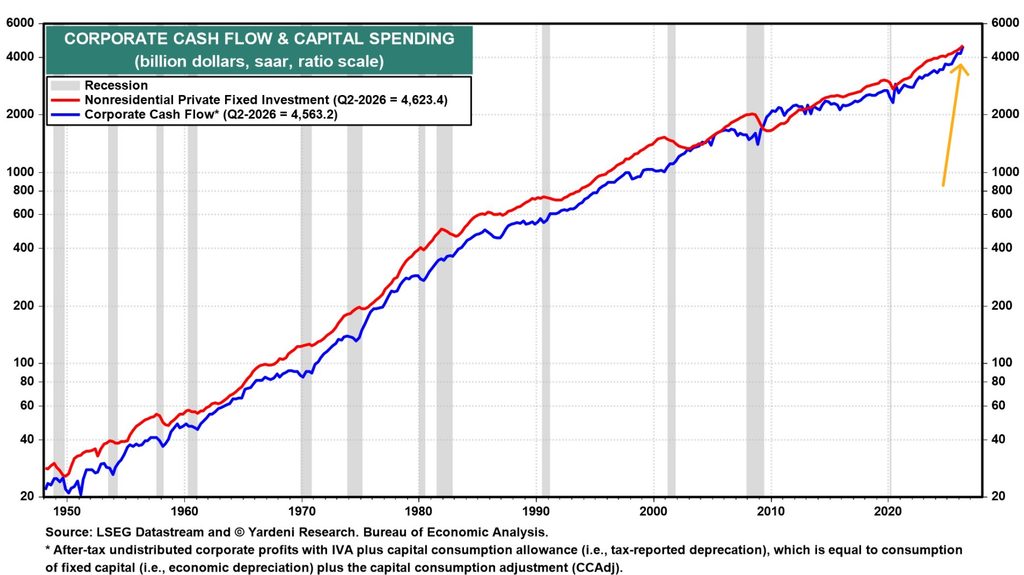
The capex question matters just as much as the earnings question. As of Q2 2026, nonresidential private fixed investment sits at 4,623.4 billion dollars. Corporate cash flow sits at 4,563.2 billion. The two figures are nearly identical, and both have climbed at a similar pace for several years.
This tells you spending is being funded by real profit generation, not by companies stretching far beyond what they earn. The risk case shows up if capex keeps climbing while cash flow stalls. That gap is not visible in the data right now.
The Setup: Room to Run Until the Trend Changes
Four charts, one consistent signal. Earnings are rising steeply. The forward multiple has room below recent highs. Price sits inside a reasonable valuation band. Capital spending is tracking cash flow rather than outrunning it.
That combination points to more room for stocks to climb, as long as it holds. Watch for two things going forward. Forward earnings starting to flatten, or capex pulling ahead of cash flow. Either shift would echo the kind of divergence that preceded past downturns. Until then, the data supports a constructive read.
Worth noting the other side. Trailing and cyclically adjusted valuations sit above forward P/E and remain near dot com era levels. A large share of recent earnings growth is concentrated in a small group of AI related companies. The capex chart shown here is economy wide, not AI specific, so it does not confirm that AI spending itself is earnings backed at the company level. This is one lens on the data, not a forecast.
This is written for informational purposes and reflects one interpretation of the data rather than investment advice.
Source: Yardeni
Leave a Reply