Category: Stock Market

  • 6 Scenarios That Can Turn Gold Price Bullish Momentum

    6 Scenarios That Can Turn Gold Price Bullish Momentum

    Gold price just went through a wild week. The Federal Reserve hiked rates. The Bank of Japan followed with its own hike. Normally, higher rates hurt gold. Yet gold still bounced. That surprised a lot of traders.

    So what would it actually take for gold to build real bullish momentum from here? Below are six scenarios worth watching.

    1. The Fed Turns Toward Rate Cuts

    Gold thrives when interest rates fall. Lower rates reduce the opportunity cost of holding a non yielding asset like gold. Right now, the Fed just hiked and signaled more hikes ahead. That is the opposite of gold friendly policy.

    For gold price momentum to shift, we would need softer inflation data. We would also need weaker jobs numbers. Any dovish tone from Fed officials could reignite gold buying fast.

    2. The US Dollar Weakens

    Gold is priced in US dollars. When the dollar drops, gold gets cheaper for buyers overseas. That usually boosts demand.

    A weaker dollar can come from many places. It could stem from other economies performing better than the US. It could come from rising US debt concerns. It could even come from other central banks holding firm while the Fed eventually cuts.

    3. Real Yields Fall

    Real yields matter more than headline interest rates. Real yield means the interest rate minus inflation. When real yields fall, gold becomes more attractive.

    This can happen two ways. Rates could drop while inflation stays flat. Or rates could stay put while inflation creeps higher. Either path tends to support gold price gains.

    4. Safe Haven Demand Returns

    Gold is the classic safe haven asset. Wars, political shocks, and trade tensions often send investors running toward gold.

    Recent examples include conflict in the Middle East and ongoing tariff disputes. Any fresh geopolitical shock could trigger quick safe haven buying, regardless of what the Fed is doing.

    5. Central Banks Keep Buying

    Central banks have been buying gold at a record pace for years. China’s central bank has added to its gold reserves for many consecutive months.

    This steady demand acts like a price floor. It also signals long term confidence in gold as a reserve asset. If this buying trend continues or accelerates, it adds fuel to any bullish move.

    6. Doubts Grow Over Fed Independence

    This is a newer factor. Political pressure on the Federal Reserve has been rising. Some analysts, including JPMorgan, have flagged this as a real risk to Fed credibility.

    If investors start doubting the Fed’s independence, they often turn to hard assets like gold as a hedge. This kind of institutional trust issue can be a powerful, longer lasting driver.
    cta gold trend x

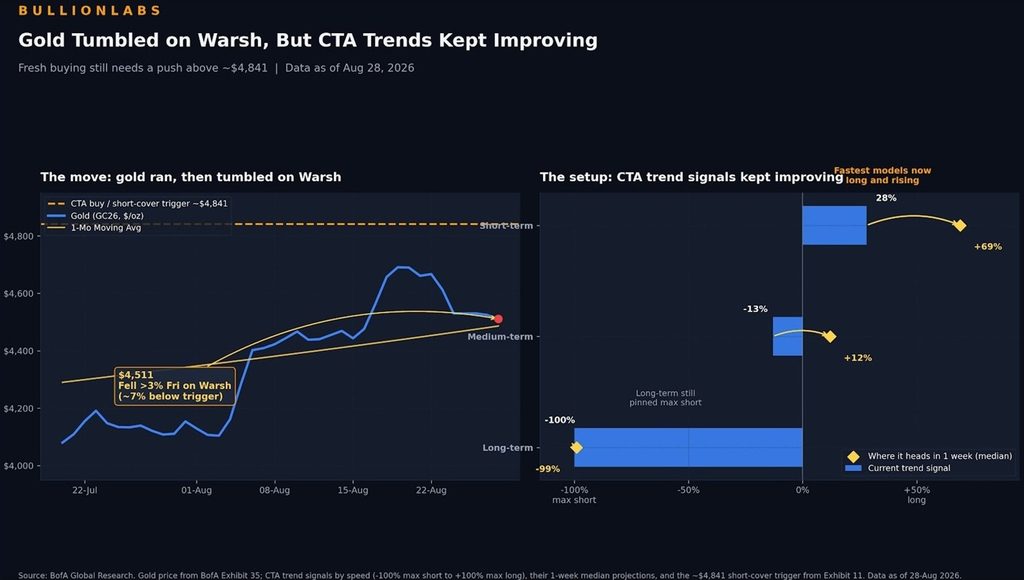
    Gold Pulls Back on Hawkish Warsh Speech, But Systematic CTA Signals Point to Growing Momentum.

    The Bigger Picture

    Right now, the setup is mixed. Rate hikes and a firmer dollar are working against gold in the short term. But the long term case, driven by central bank demand and debt concerns, remains intact.

    Interestingly, price action is not only being shaped by these macro scenarios. Systematic trend signals are also flashing early signs of a turn. For a closer look at how CTA positioning and key technical levels like $4,841/oz could accelerate a breakout, check out our full breakdown in Gold Pulls Back on Hawkish Warsh Speech, But Systematic CTA Signals Point to Growing Momentum.

    Sources:
    Trading Economics, “Gold Rebounds 2% as Investors Reassess Fed Rate Hike”
    CMC Markets, “The Week Ahead: US Federal Reserve, Bank of Japan, UK inflation”
    KuCoin News, “Goldman Sachs Lowers Gold Price Target, Expects No Fed Rate Cuts in 2026”
    Outlook Money, “Gold, Silver May Retain Strength Next Week As Traders Eye Fed Meeting Minutes”
    Kitco News, “Gold prices finds new momentum as the Fed cuts rates”
    Angel One, “Gold Price Hit All Time on December 22 on Rate Cut by US Fed”
    Yahoo Finance via Favish, “Gold Could Surge as High as $4,250 Next Year Amid Uncertainty Over Fed: JPMorgan”
  • Is the Stock Market Signaling a Bottom?

    Is the Stock Market Signaling a Bottom?

    Markets rarely ring a bell at the bottom, but stock market bottom signals tend to line up right before one forms and right now, several of them are worth watching together.

    Nasdaq 100 breadth is flashing the same bottom signal again

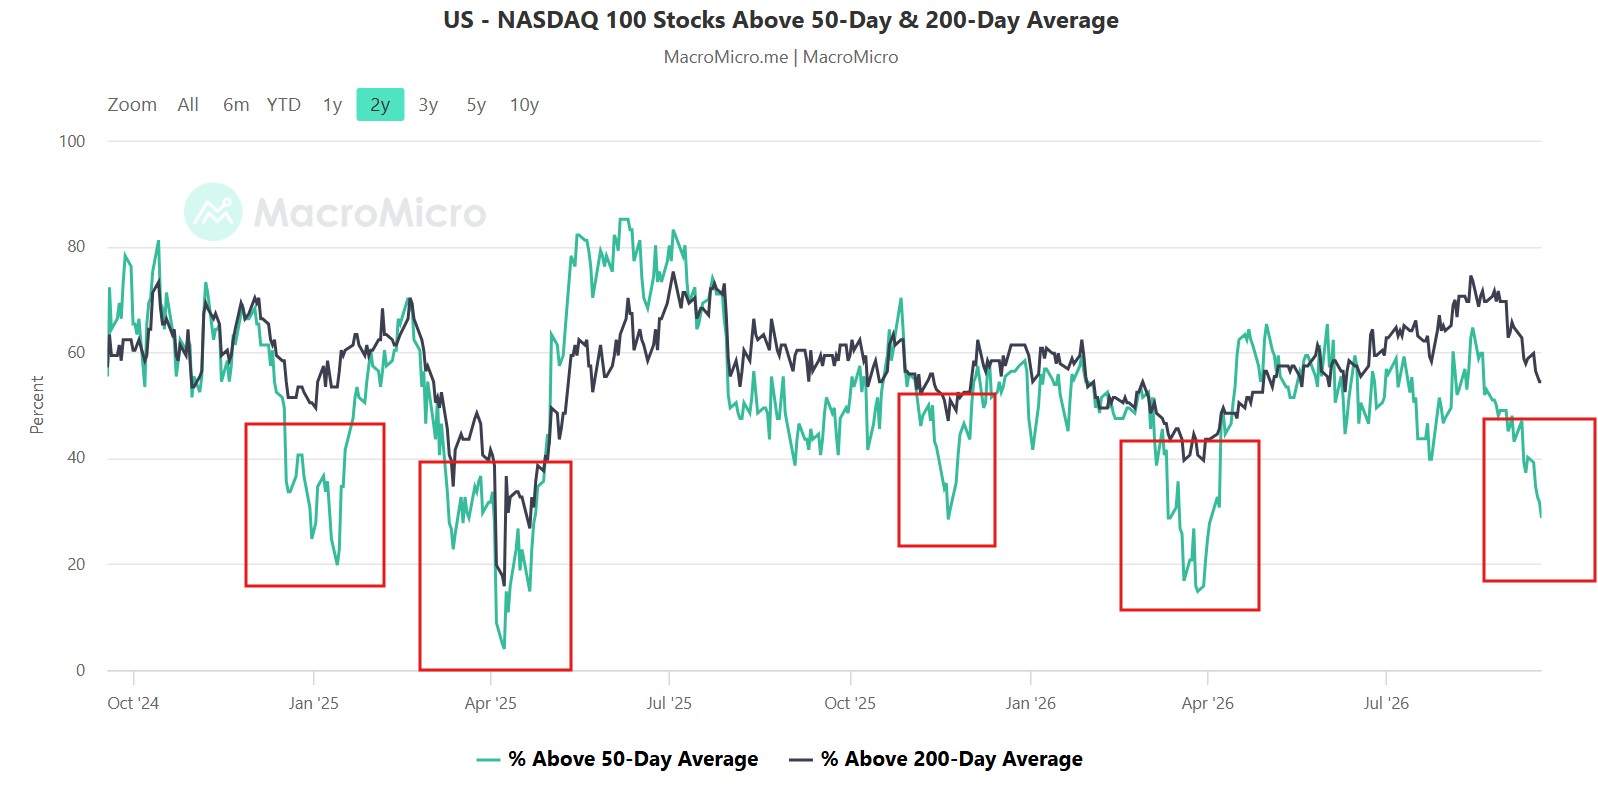
    Nasdaq 100 stocks above the 50 day average are falling fast, down to 29% from 31% the prior session, while stocks above the 200 day average sit at 54%. That gap between the two lines is opening up again.

    We’ve seen this setup before. Dec 2024, Apr 2025, Sep to Nov 2025, and Mar 2026 all had the same large gap, and each time it bounced back short term, forming a W shaped bottom. The deepest of those, April 2025, saw the 50 day reading drop into single digits before snapping back above 80 within weeks.

    Right now we’re only at the early stage of that pattern. Past dips went much lower before turning, so breadth could still fall further before this plays out the same way.

    Margin debt is climbing again, right as price stalls

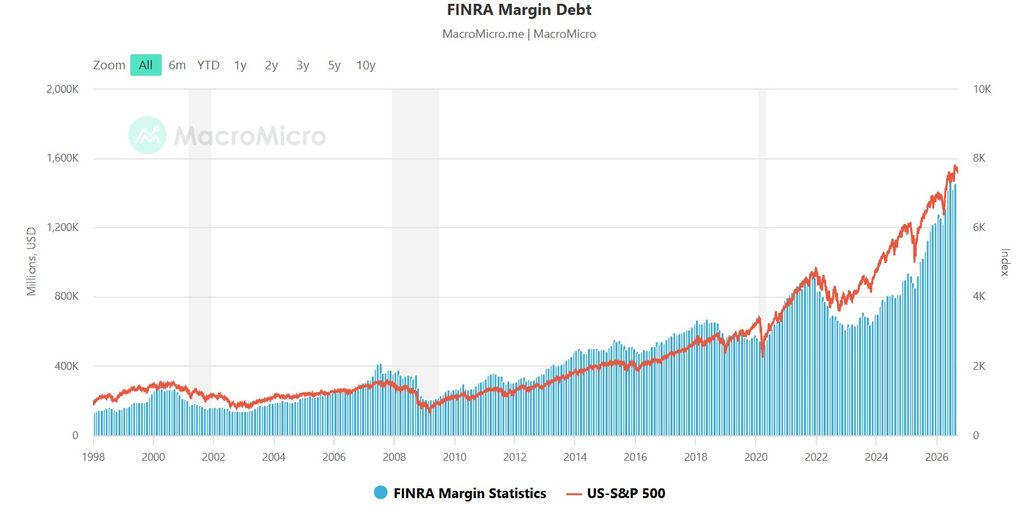
    Margin debt is the amount investors have borrowed to buy stocks, and it’s a good read on how much risk people are willing to take on. As of August 2026 it sits at about 1.45 trillion dollars, up from roughly 1.42 trillion the month before. That’s a meaningful jump in just one month.

    margin debt

    What makes this worth watching is the timing. Over that same stretch, the S&P 500 barely moved, slipping slightly from about 7,638 down to around 7,620. So investors piled more borrowed money into stocks even as prices flattened out. That’s usually not a comforting sign. When leverage keeps rising while price momentum fades, it means more people are exposed if the market turns lower, since margin positions can get forced to sell during a drop, which adds extra pressure to any decline.

    Looking at the full history, margin debt has tracked the S&P 500 almost exactly for years, climbing right alongside the market with no real separation between the two. That tight relationship, combined with the debt still rising into a stalling market, points toward more risk sitting under the surface right now, not less.

    Fear is building, but it’s not extreme yet

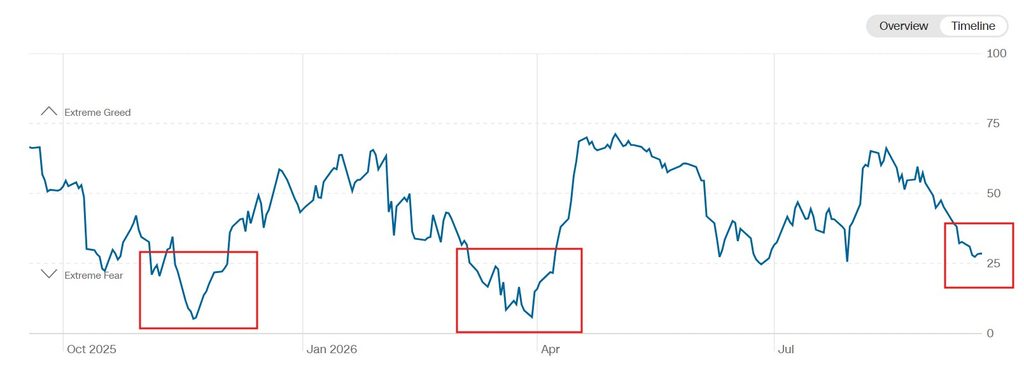
    The CNN Fear and Greed Index is sitting in the high twenties, which puts it in Fear territory. Extreme Fear doesn’t start until the index drops below 25, so we’re close but not there yet.

    fear and greed index

    This index has swung between fear and greed more than once over the past year, so on its own it’s not a reliable timing tool. But when it’s paired with weakening breadth and rising leverage, it adds more weight to the idea that sentiment still has room to get worse before it turns.

    Options traders are leaning bearish

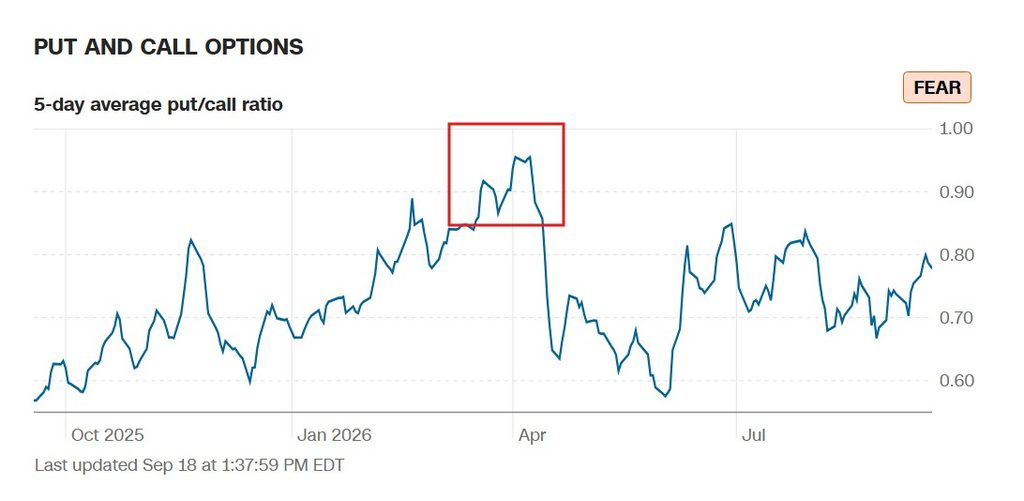
    The put call ratio measures how many put options are trading compared to calls. A reading above 1 means more puts are changing hands, which usually signals fear. This year the ratio has crossed above 1 more than once, hitting 1.12 in late June, and it’s remained elevated at times since, printing around 0.80 with its short term average sitting near the top of its recent range.

    putcalloptions

    A high put call ratio is often read as a contrarian bullish signal, since heavy put buying tends to show up near lows rather than before big declines. The ratio hasn’t stayed above 1 consistently though. It’s been bouncing around, which suggests traders are nervous but not in full panic mode yet.

    Big tech earnings are still doing the heavy lifting

    Even with all this going on, mega cap tech companies keep posting strong numbers. Several of the biggest names have been the main drivers of S&P 500 earnings growth over the past few quarters, and that’s the fundamental reason a lot of investors are still willing to hold through the volatility.

    The catch is spending. These companies are pouring enormous amounts of money into AI infrastructure, and companies like Micron are seeing Wall Street raise the bar again and again as AI memory demand grows, while that same demand is showing up directly in memory chips, where SK Hynix is already sold out months ahead. Some have guided capital spending above 175 billion dollars for the year. The market is starting to demand proof that spending pays off, and if growth numbers come in even slightly soft compared to it, the reaction has been sharp.

    So Are These the Stock Market Bottom Signals?

    Not quite yet. Today’s data doesn’t show clear stock market bottom signals, at least not so far. Breadth is weakening but hasn’t reached the extreme lows that marked past turning points. Margin debt is rising into a stalling market instead of pulling back, which adds risk rather than removing it. Sentiment is fearful but not extreme. Options activity shows nervousness building, not panic.

    History suggests this pullback may still have room to run before it’s finished. If the past cycles are any guide, expect breadth to fall further, leverage to stay elevated, and fear to deepen before a real bottom forms. That doesn’t mean avoid the market entirely. It means this could be a good time to watch closely and build a plan, rather than rush in.

    This is not financial advice. Always do your own research and consider your own risk tolerance before making any trading decisions.

    Source: Fear & Greed Index, MacroMicro