TRX Gold Stock (NYSE: TRX, TSX: TRX) digs gold out of one mine in Tanzania. Production jumped 57% in fiscal 2026. Profits and cash flow are growing fast.
However, stock price sits around $0.95 to $1.00, after a drop of about 7% on Oct 30 with no clear news behind it. That is far below where it traded earlier this year.
What does TRX Gold Corporation actually do?
TRX Gold is a gold producer. It has one asset, the Buckreef Gold Mine in the Geita region of Tanzania.
It is an open pit mine with a processing plant that handles about 2,000 tonnes of rock per day. The plant turns that rock into gold bars, which TRX sells at market prices.
TRX Gold owns 55% of the mine through a joint venture. Tanzania’s state mining company, STAMICO, owns the other 45%.
The mine holds about 893,000 ounces of measured and indicated gold, plus another 726,000 ounces of inferred gold. That is roughly 1.6 million ounces in the ground.
Revenue. Q3 FY26 revenue was $32.8 million. A year ago it was $12.5 million. That is growth of about 163%.
Compared with the quarter before, revenue slipped 3.7% from $34.1 million. TRX sold fewer ounces (6,983 versus 7,314) because it kept more gold in the plant and in stockpiles. The gold price helped, with a realized price of $4,703 per ounce versus $3,114 a year earlier.
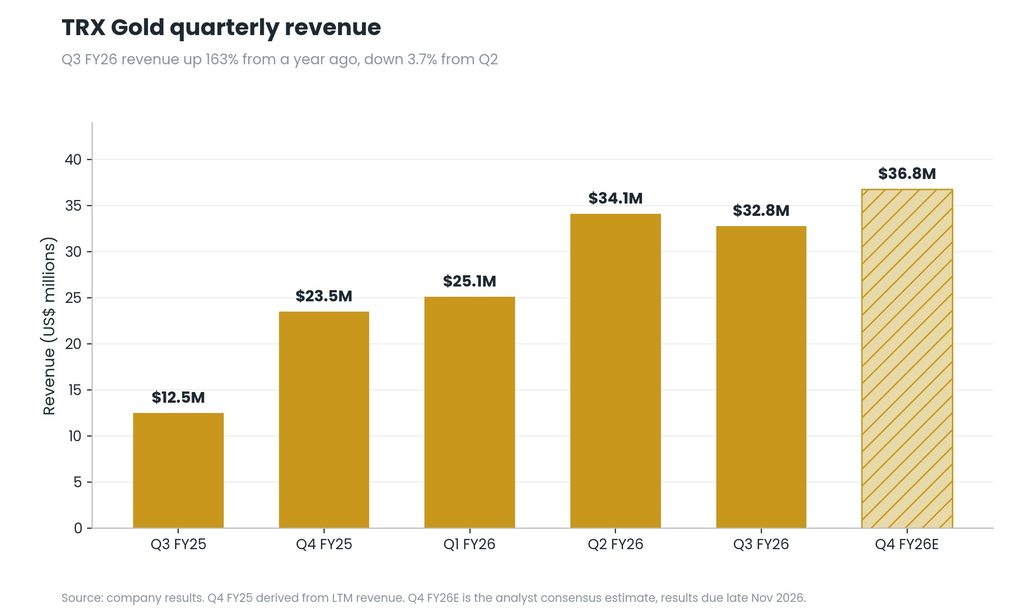
The quarter by quarter climb looks like this. Q1 revenue was $25.1 million, up 101% from a year before. Q2 jumped 36% to $34.1 million, up 274% year over year. Then Q3 held steady near the top. Over the last twelve months, revenue came to $115.5 million.
EBITDA. Adjusted EBITDA hit a record $20.7 million in Q3. A year ago it was $4.0 million. That is about x5 times higher.
It has also improved every quarter this year: $13.2 million, then $20.2 million, then $20.7 million. Over the last twelve months it totals $66.8 million. The gross margin in Q3 was 59%.

EPS. Q3 earnings per share came in at about $0.01 eventhough analysts estimated $0.04. Revenue also missed the $35.75 million estimate. (The stock fell about 5.7% after the report).
However, if you look at the net income, TRX recorded $8.4 million GAAP profit in Q3. Adjusted net income was $10.1 million, versus $2.0 million a year ago.
EPS could look a bit messy, Q2 had a $13.8 million net loss. That is because of a $23.5 million non cash charge tied to warrants and those warrants have now all been exercised or have expired. Then,the company raised about $21 million from the exercises, so I think share structure is cleaner now.
For the first nine months of the year, GAAP net income is still a loss of $5.9 million because of that one charge. Analysts expect Q4 EPS of around $0.03 to $0.04 on about $36 million to $37 million of revenue.
Cash flow has improved a lot, though not as much as EBITDA.
Operating cash flow in Q3 was $8.8 million, versus $1.9 million a year ago. For the first nine months it was $20.5 million, versus $6.1 million. Over the last twelve months it was $28.9 million.

EBITDA could show lower in two reasons though. Income tax took about $7.7 million in Q3. And TRX has been building inventory and working capital, about $19.3 million over the last year.
Capex. TRX spent $27.1 million on capital assets over the last twelve months. That is almost the same as its operating cash flow, so free cash flow is roughly flat for now. The company is choosing to reinvest.
Over the next year, management expects to spend $45 million to $50 million on the expansion and exploration.
Cash and debt. Cash was $26.8 million at May 31, and the CEO said about $30 million in October. There are also undrawn credit lines above $12 million. Working capital is $36.3 million, and the current ratio is 2.2. Outside of equipment leases, the company has no debt.
Short Term Production
TRX is upgrading its existing 2,000 tonne plant. New pieces include a pre leach thickener, better agitators, an oxygen plant and an Aachen reactor.

The results are showing. Gold recovery rose from 67% to 84.9% in a year. Throughput hit a record, roughly 1,700 to 1,800 tonnes per day. Q4 production reached a record 8,173 ounces, up 28% from last year.
Now the honest part. Processing cost per tonne rose to $25.66 from $14.60. Cash cost per ounce in Q3 was $1,648, above the full year target range of $1,400 to $1,600. For nine months it was $1,555, which is inside the range. Management expects costs per tonne to fall once the upgrades run at normal capacity.
Part of the Q4 jump also came from drawing down stockpiles. Year end inventory numbers will show how much of it was real plant performance.
Long Term Production
The big project is a brand new mill with 3,500 tonnes per day of capacity. It will run next to the existing plant. Together they could handle up to 5,500 tonnes per day.
The contract is signed and the timeline is 12 to 18 months. The CEO expects the plant to be largely running by the end of calendar 2027. He also said it may not hit the full 5,500 tonnes per day, depending on the mine plan.
Test work points to recoveries of 89% to 92%, above the 88% used in the 2025 study. An updated economic study is due late 2026 or early 2027. It is expected to show a larger open pit and possibly an earlier start for underground mining.
Exploration is also stepping up. TRX drilled about 14,500 metres in fiscal 2026 and is adding rigs. It is targeting 10 anomalies, plus areas called Stamford Bridge, Anfield and the Eastern Porphyry.
The Goal
Management wants to produce more than 80,000 ounces a year after the expansion. It also talks about EBITDA above $200 million within 3 to 4 years at current gold prices. Today’s run rate is about $80 million.
Are they on track?
The Positives: full year production hit 29,650 ounces, the top of the 25,000 to 30,000 ounce target. The mill contract is signed. Recoveries are up. Drilling is ramping.
The Risks: costs per tonne are higher. Q3 cash cost was above the range. The plant is still running below its 2,000 tonne nameplate. And the updated study is not out yet.
What is the guidance?
Short term. For fiscal 2026 the company guided to 25,000 to 30,000 ounces at a cash cost of $1,400 to $1,600 per ounce. Production landed at 29,650 ounces. I could not find formal guidance for fiscal 2027 yet. The annual report in late November is the place to look.
Long term. The 2025 study pointed to 62,000 ounces a year over 17.6 years. Management now says the bigger plant should beat that and exceed 80,000 ounces.
That study also assumed cash costs near $1,000 per ounce. Today’s costs are around $1,500 to $1,650. Closing that gap is one of the key things to watch.
Who owns the stock?
The company describes its shareholders as about 70% retail, 15% institutional and 15% management, friends and family.
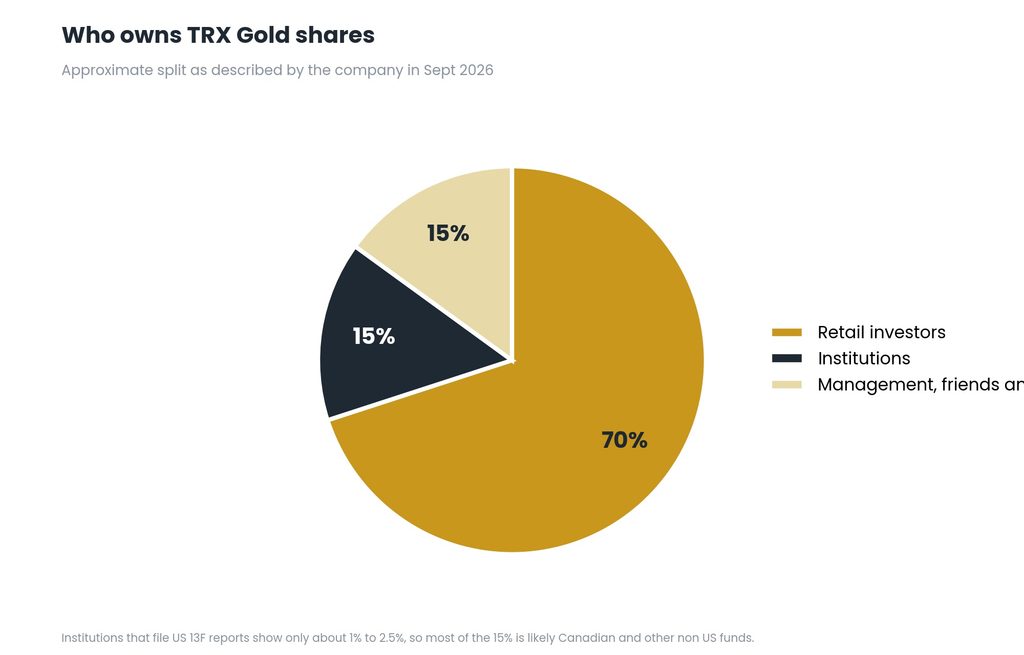
That 15% institutional number looks high next to US filings. Data providers that track US institutional filings show only about 1% to 2.5%. My guess is that many of the funds are Canadian or from other countries, and they do not appear in those US reports.
Why TRX Gold Stock could be worth investing in?
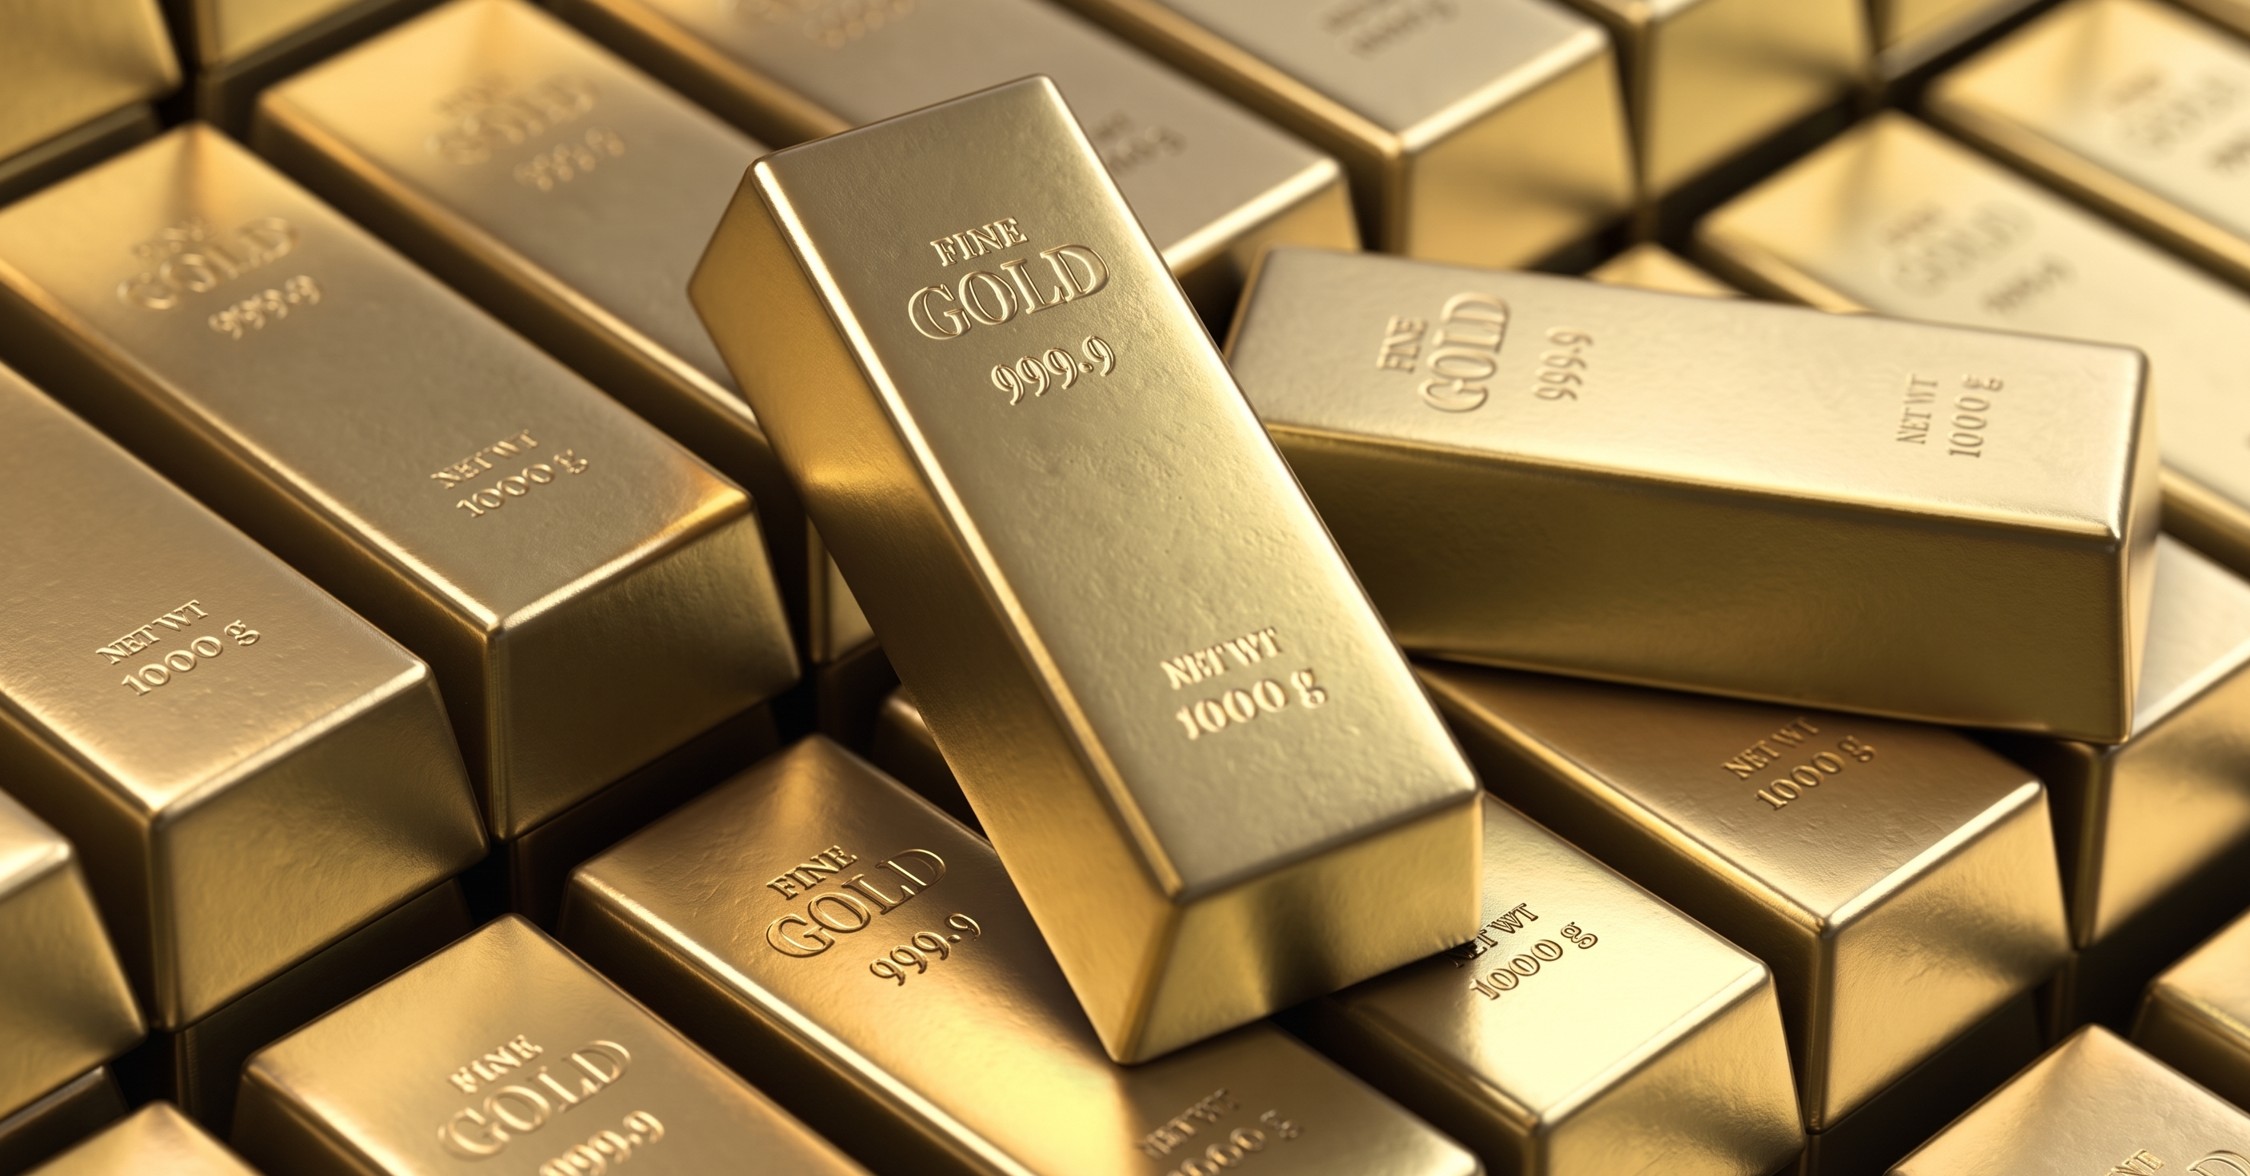
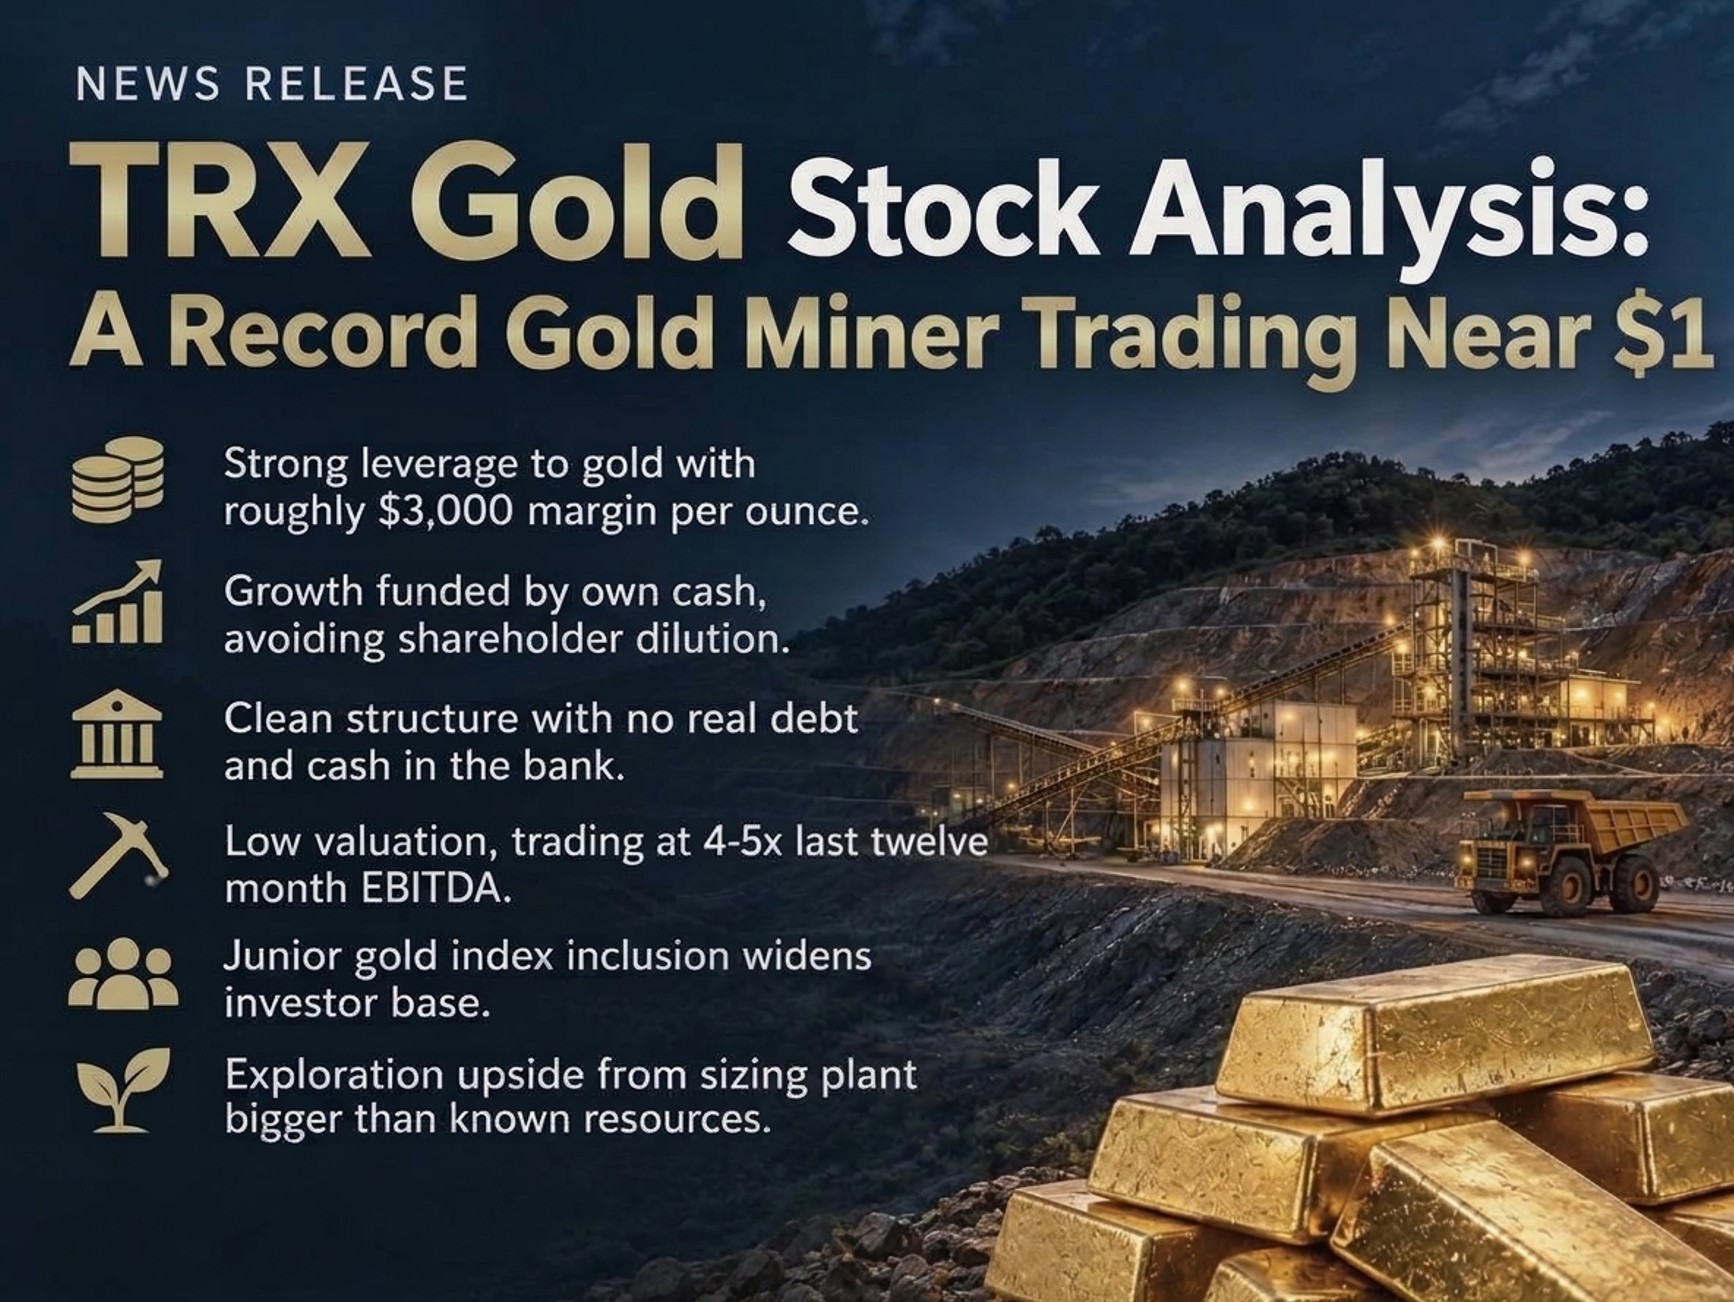
- Strong leverage to gold. TRX sold gold at $4,703 per ounce against a cash cost of $1,648. That leaves roughly $3,000 per ounce before tax and other costs.
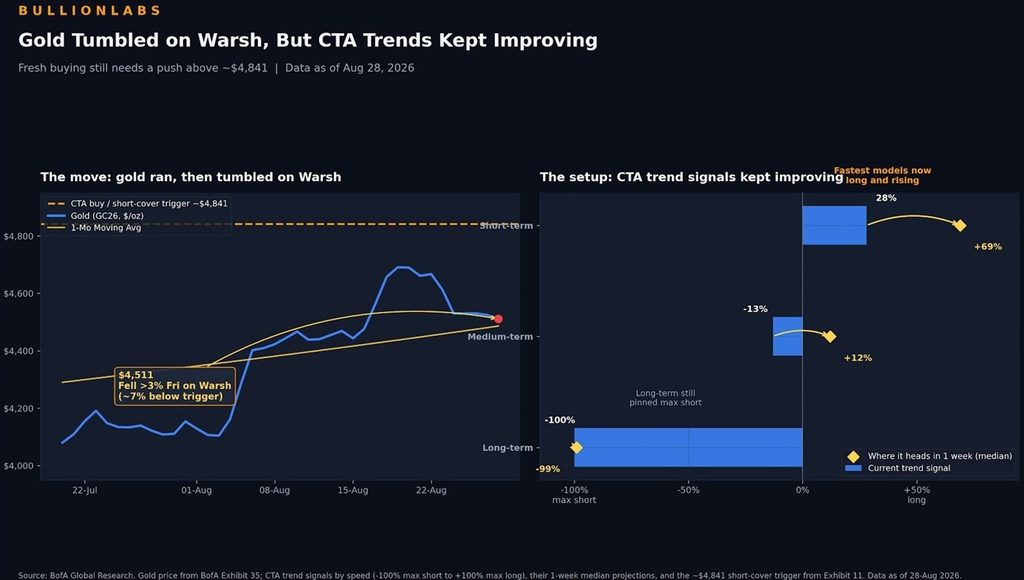
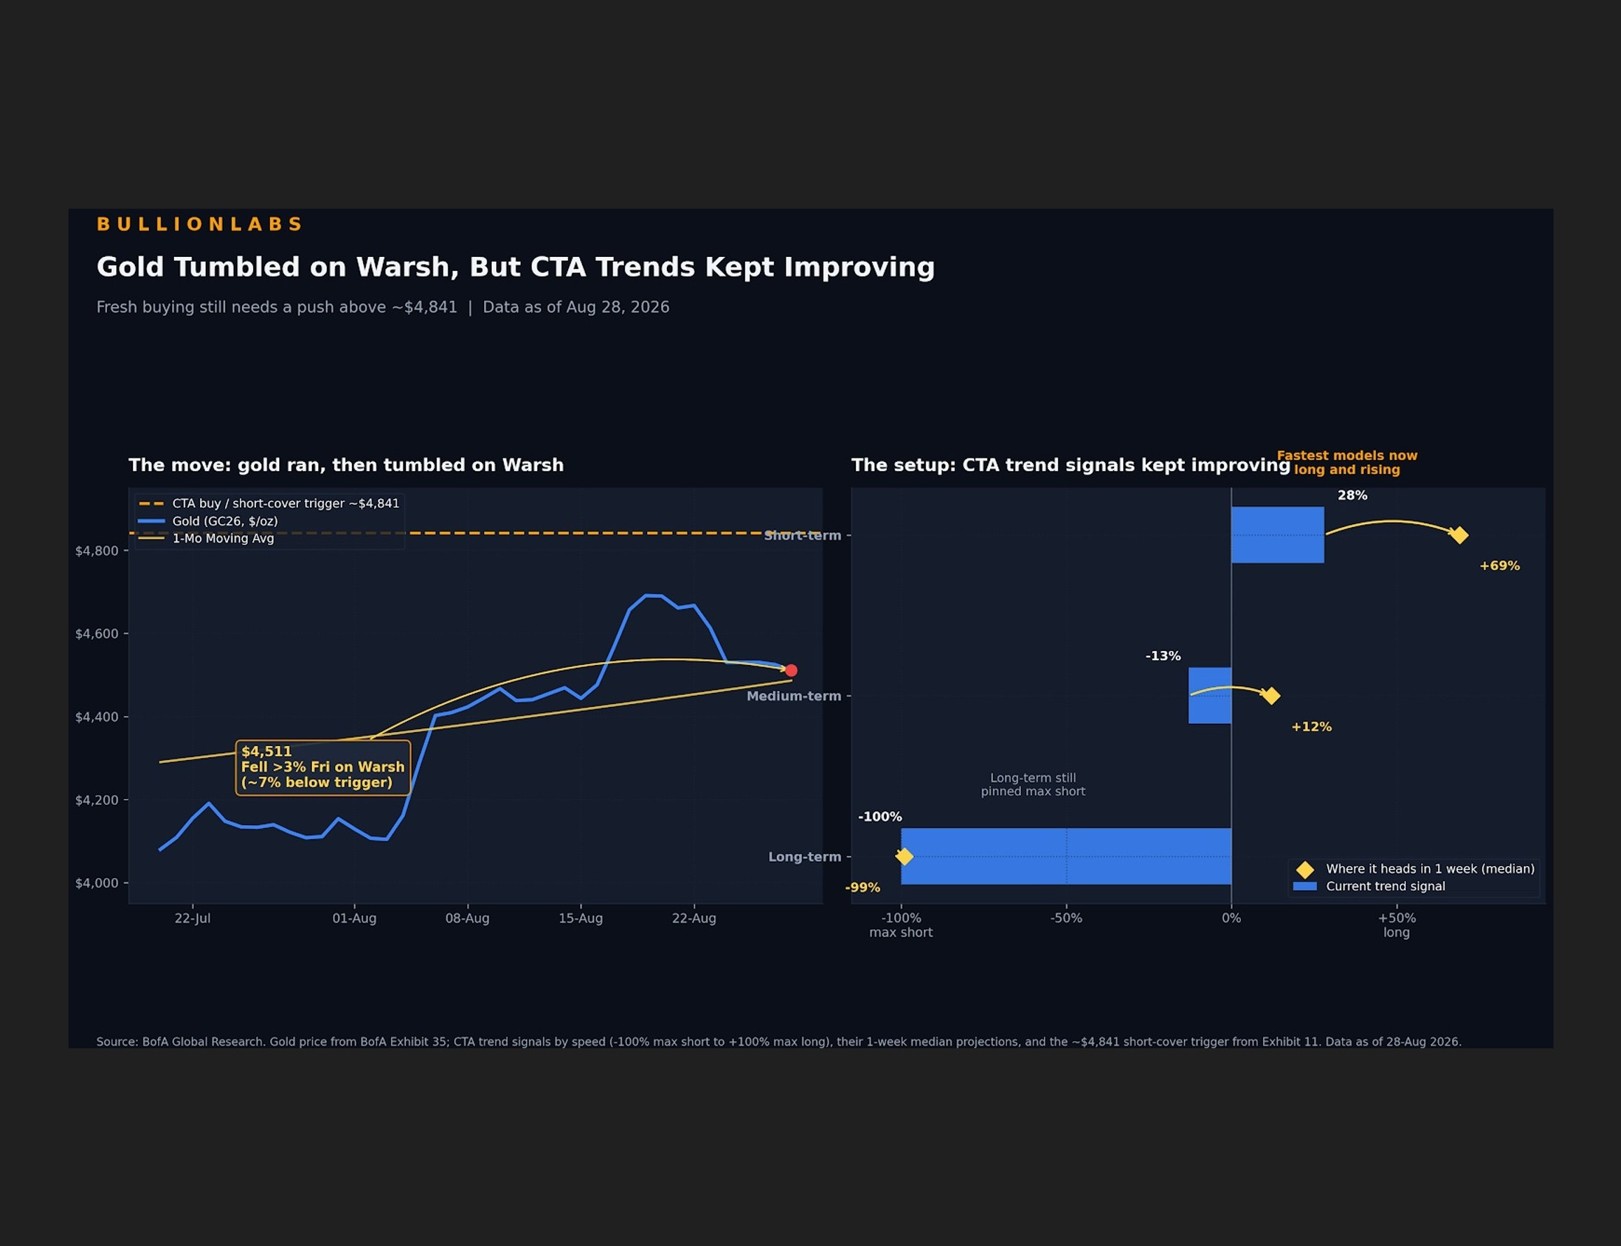
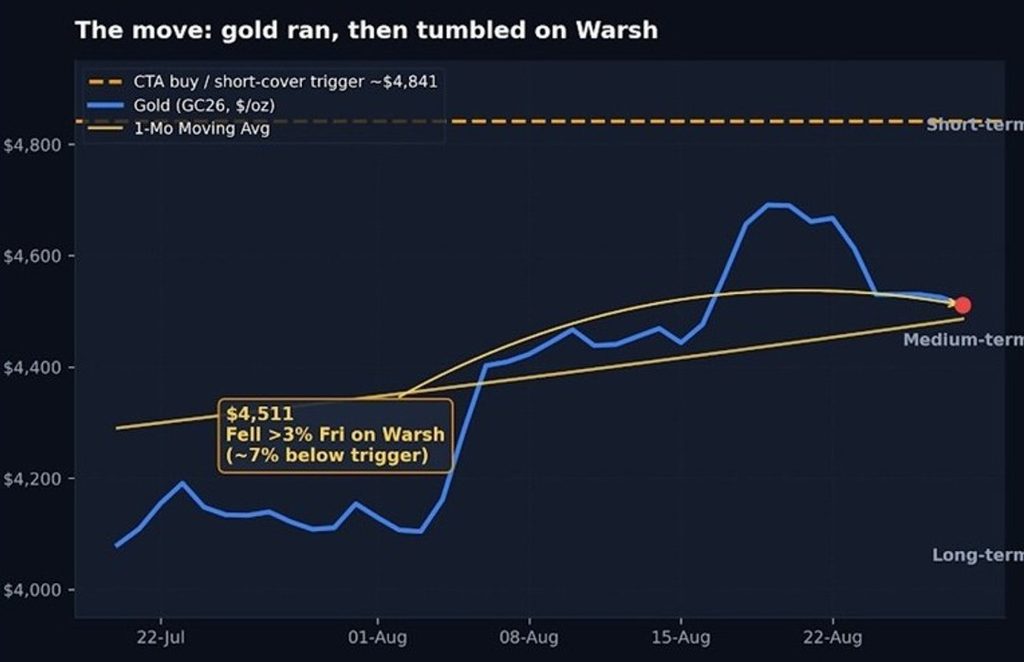
*TRX Gold earns most of its margin from the gold price, so what happens to gold matters a lot. If you want to know what could keep gold moving higher, from Fed rate cuts to central bank buying, read our breakdown of 6 scenarios that can turn gold price bullish momentum. - Growth paid by its own cash. The expansion is meant to be funded from operations, so shareholders are not diluted.
- A clean structure. No warrants, no real debt, and cash in the bank.
- A low valuation for the numbers. At a market cap near $310 million and last twelve month adjusted EBITDA of $66.8 million, the stock trades at roughly 4 to 5 times EBITDA.
- Index buying and new eyes. Inclusion in junior gold indexes widens the pool of buyers.
- Exploration upside. The plant is being sized bigger than the known resource, so new discoveries matter. Good drill results could change the story.
Does TRX Gold have a moat?
What TRX does have: a low cost mine, a special mining license plus 12 prospecting licenses covering about 98 square kilometres, and almost two decades of presence in the region. It has finished three mill expansions on time and on budget. It also holds four of seven board seats in the joint venture.
The risks you should know
Tanzania and the joint venture. The government’s 45% stake can be diluted, and TRX is in talks to move to a standard framework. That could mean a 16% free carried government interest and a 50/50 economic split once taxes and royalties are counted. The CEO calls the process slow and political. TRX also repays a loan of about $30 million to the project before dividends are shared.
One mine. Any operational problem hits the whole company.
Gold price. Margins are huge today because gold is near $4,700. A big drop would hurt fast.
Costs and execution. Costs per tonne are up, and the expansion has to land on time.
A retail heavy shareholder base. That can mean big swings, like the 7% drop on Oct 30.

TRX Gold Stock Target price
Three analysts follow the stock closely, and all three sit above $2.
HC Wainwright rates it a Buy with a $2.30 target. The firm raised it from $1.50 in March and repeated it in June.
Roth Capital also says Buy, with a $2.25 target set in February. That was up from $1.25 before.
Zacks Small Cap Research has a fair value of $2.40, based on the value of TRX’s 55% share of Buckreef. These reports are published on the company’s own investor site, so keep that in mind.
Yahoo Finance shows an average target of $2.36 across three analysts, with a range of $2.25 to $2.50.
Against a price near $0.95, that means upside of roughly 137% to 153%. In plain words, the targets are more than double the stock.
What to watch next
- Q4 and full year results, expected in late November (data providers list Nov 27 or Nov 30).
- Fiscal 2027 guidance.
- Year end inventory, to see how real the Q4 production jump was.
- The updated economic study.
- First results from the new drill rigs.
- Any news from the talks with Tanzania.
That is my take on TRX Gold. The business is growing fast, the balance sheet is healthy and the plan is funded.
Disclosure: The author holds a long position in $TRX Stock at the time of writing
Sources and notes
TRX Gold press releases for Q1, Q2 and Q3 FY26 results (Jan 15, Apr 15 and Jul 15, 2026) and the Q4 production update (Sept 14, 2026). MarketBeat coverage of the CEO’s Oct 6, 2026 webinar. Zacks Small Cap Research notes. Crux Investor articles on the expansion and ownership. Yahoo Finance, Investing.com and MarketBeat for analyst targets and earnings estimates.